-
 Platform OverviewOne command center for local marketing performance IntegrationsCentralize your stack for faster insights and measurable results Why Us?Driving growth for 110+ enterprise and franchise networks worldwideal success
 -
By business type Brand GroupsUnify local marketing across brands Franchise HQsStreamline marketing across franchisees ResellersRebrand our platform and sell it as your own Multi-Location BrandsStreamline local marketing at scale Emerging FranchisesOutshine big brands and expand faster AgenciesDeliver local success for every clientBy industry RetailDrive sales with local campaigns Restaurants & QSRGrow foot traffic with social and reviews Home ServicesWin more local bookings FitnessAttract clients near you Property ManagementHelp agents connect locally Education ServicesConnect with local customers Wellness & BeautyBuild trust throght reviews AutomotiveGet found in local search
-


-
Platform OverviewOne command center for local marketing performance IntegrationsCentralize your stack for faster insights and measurable results Why Us?Driving growth for 110+ enterprise and franchise networks worldwideal success
-
By business type Brand GroupsUnify local marketing across brands Franchise HQsStreamline marketing across franchisees ResellersRebrand our platform and sell it as your own Multi-Location BrandsStreamline local marketing at scale Emerging FranchisesOutshine big brands and expand faster AgenciesDeliver local success for every clientBy industry RetailDrive sales with local campaigns Restaurants & QSRGrow foot traffic with social and reviews Home ServicesWin more local bookings FitnessAttract clients near you Property ManagementHelp agents connect locally Education ServicesConnect with local customers Wellness & BeautyBuild trust throght reviews AutomotiveGet found in local search
-
Top 20 Digital Marketing Reporting Dashboard Tools


No business can be successful without clearly stated marketing goals. But how to understand whether you achieved them or not? The answer is — by analyzing the results of your marketing campaigns with the help of digital marketing reporting dashboard tools.
How many leads did you have this month? How many followers did you gain on social media networks? What is the biggest source of your website traffic? All this and other data can be obtained from various analytics tools.
However, analyzing them separately and juggling different platforms can be challenging and time-consuming. This is where digital marketing reporting dashboards come in handy. They provide businesses with valuable insights about what marketing goals ensure the best outcomes, thus enabling them to optimize campaigns and make smart data-driven decisions.
Let’s dive deep into the topic and learn what marketing dashboards are and how to use them for your marketing efforts to save time on reports as well as explore the top 20 marketing dashboard software solutions.
Digital Marketing Reporting Dashboards: The Basics
Before we move on to the overview of the best marketing dashboards, let’s start with some basic notions.
What is digital marketing reporting dashboard software?
We’ll start with the definition of a marketing reporting dashboard. Let’s draw an analogy. Imagine yourself driving a car. To drive it effectively and arrive at the necessary point of destination, you need to constantly look at the car’s dashboard (control panel) to monitor your speed, check how much gas is left, and track information about problems, such as a flat tire, etc.
The dashboard is not static — it’s constantly changing as its purpose is to reflect the situation in real-time and show what’s going on with the car right now. A car’s control panel is an example of a marketing reporting dashboard. Such dashboards allow marketing analysts to visualize data in the form of graphs, tables, heat maps, charts, scatter plots, etc. for easier perception and enable them to see the essence at once rather than going through all the indicators separately one by one.
With reporting dashboards, marketers can analyze their efforts and see:
- Whether advertising is working effectively;
- Which marketing channel is driving orders and which one is wasting the advertising budget;
- What revenue the business is getting;
- Etc.
To sum up, a digital marketing reporting dashboard (or a performance marketing dashboard) is a tool that is designed to integrate data on marketing results from various sources and provide a consolidated at-a-glance view of KPIs (Key Performance Indicators) and metrics to track and make strategic marketing decisions based on this data.
What Should A Digital Marketing Reporting Dashboard Include?
A digital marketing reporting dashboard should include a range of reports on a daily, weekly, or monthly basis and provide data on the following metrics:
- Traffic sources;
- Social media metrics (e.g., reach, engagement rate);
- Click-through-rates (CTR);
- Bounce rates;
- Email conversion rates;
- Organic search;
- Etc.
Now when you know what marketing dashboards are and why you need them, take a look at the list of the best 20 dashboards we’ve prepared for you.
Best 20 Digital Marketing Reporting Dashboards
1. PromoRepublic – the best marketing dashboard
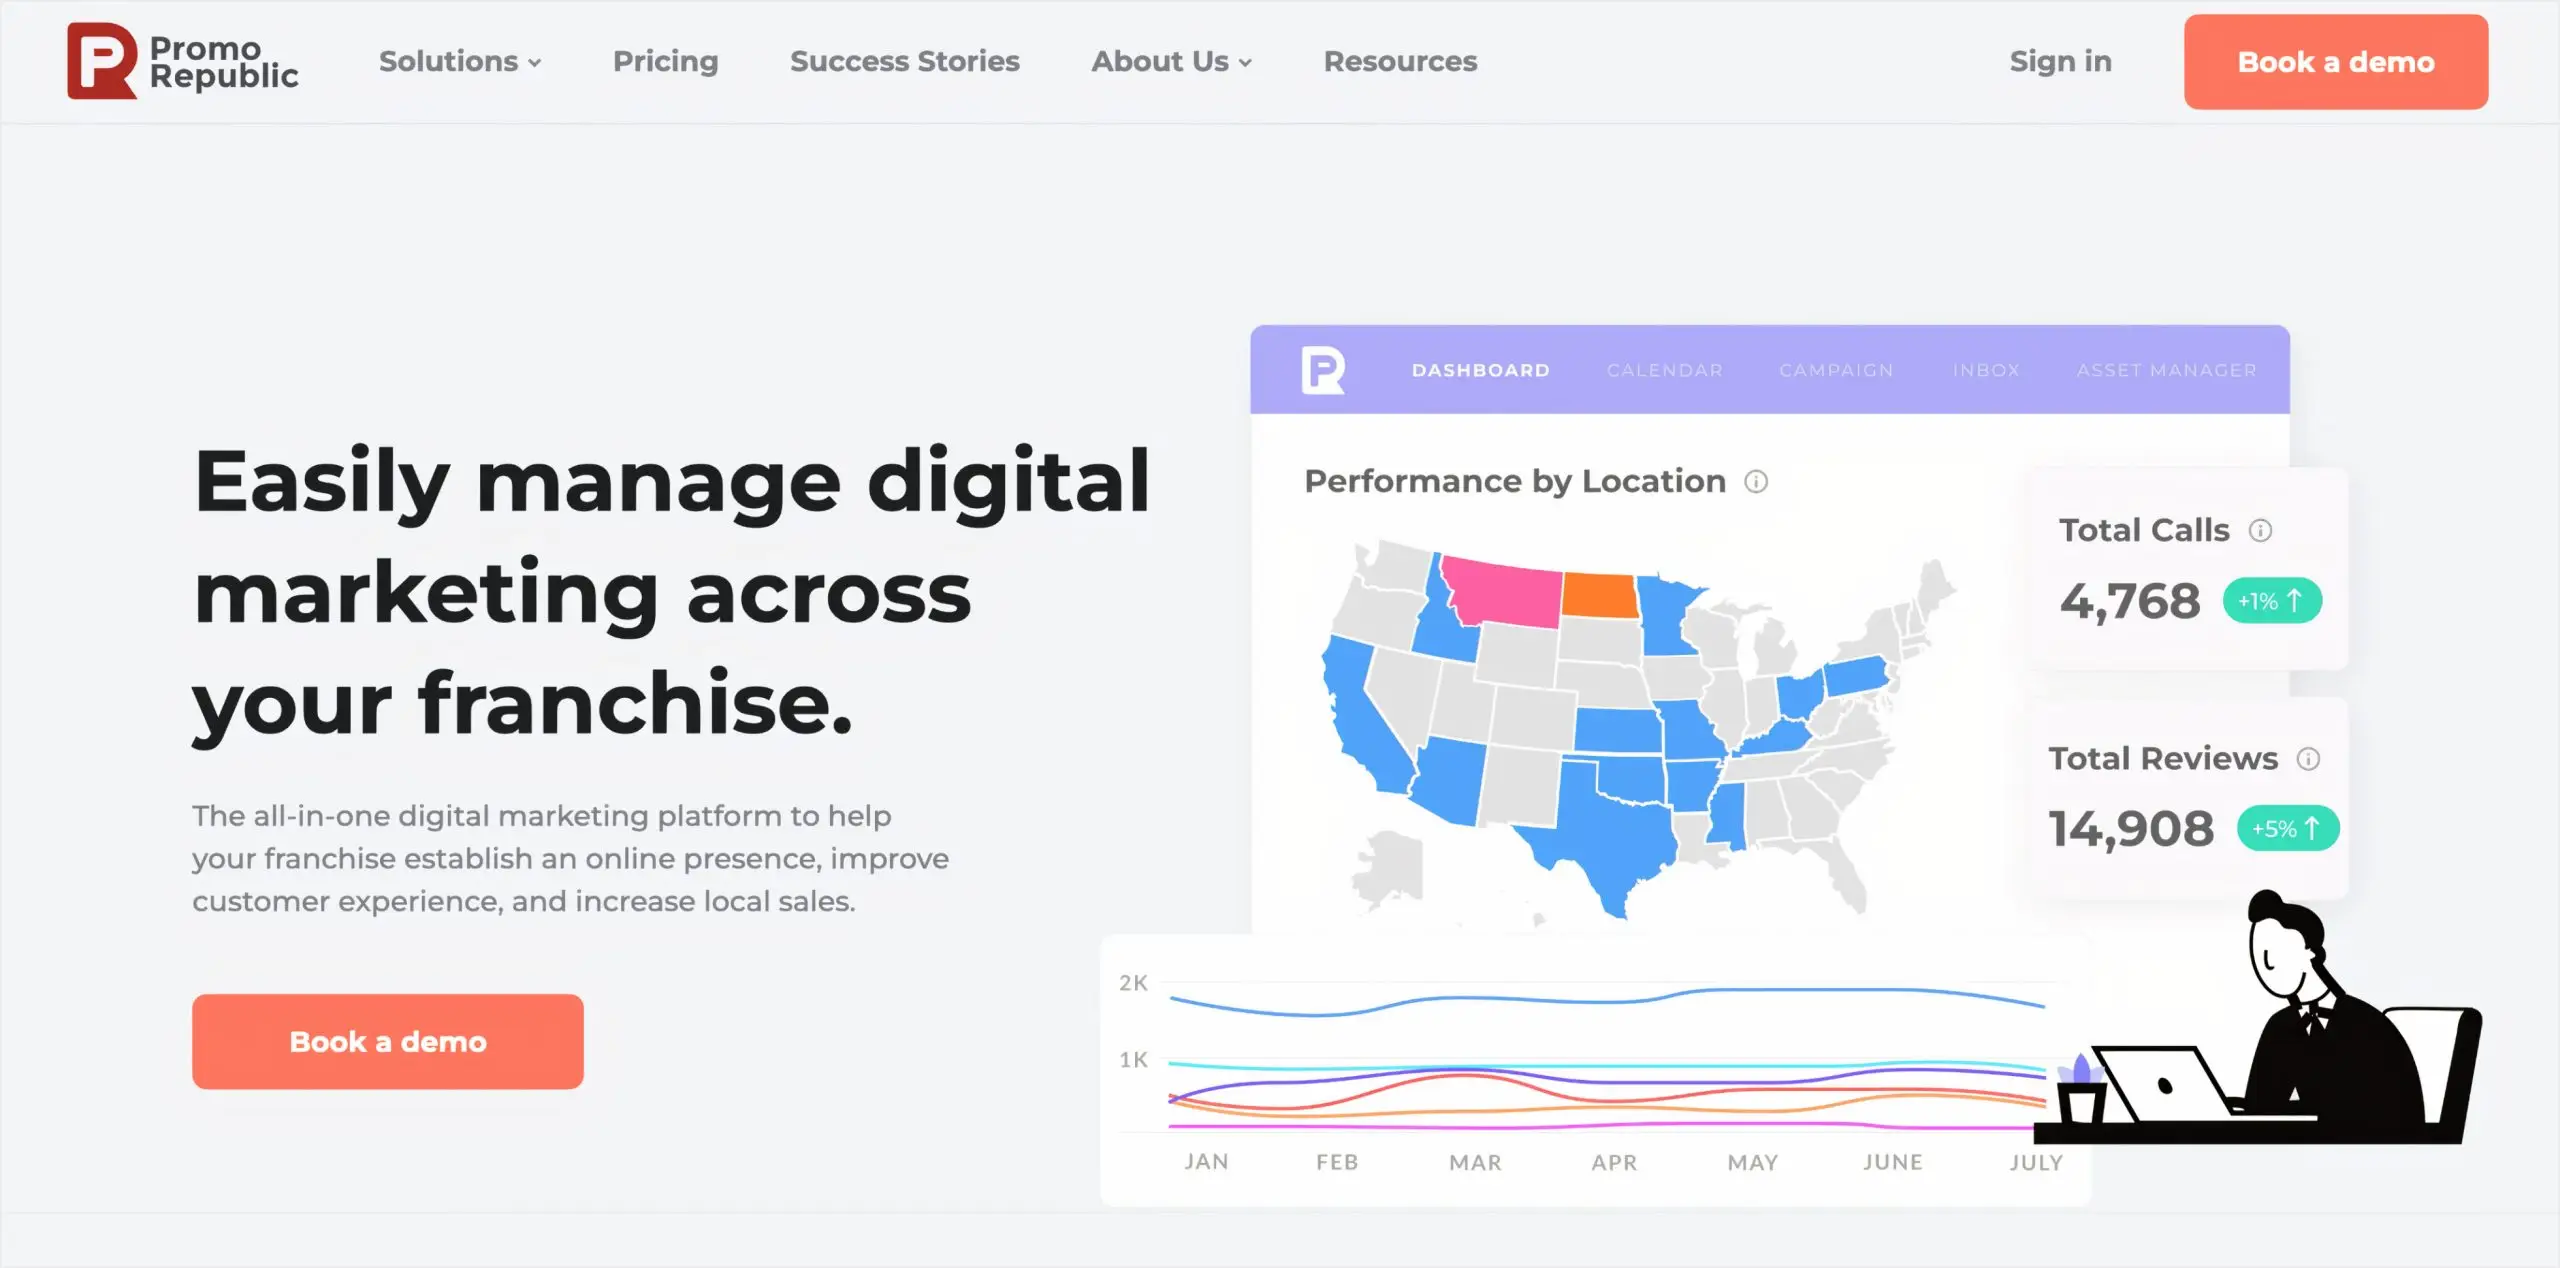
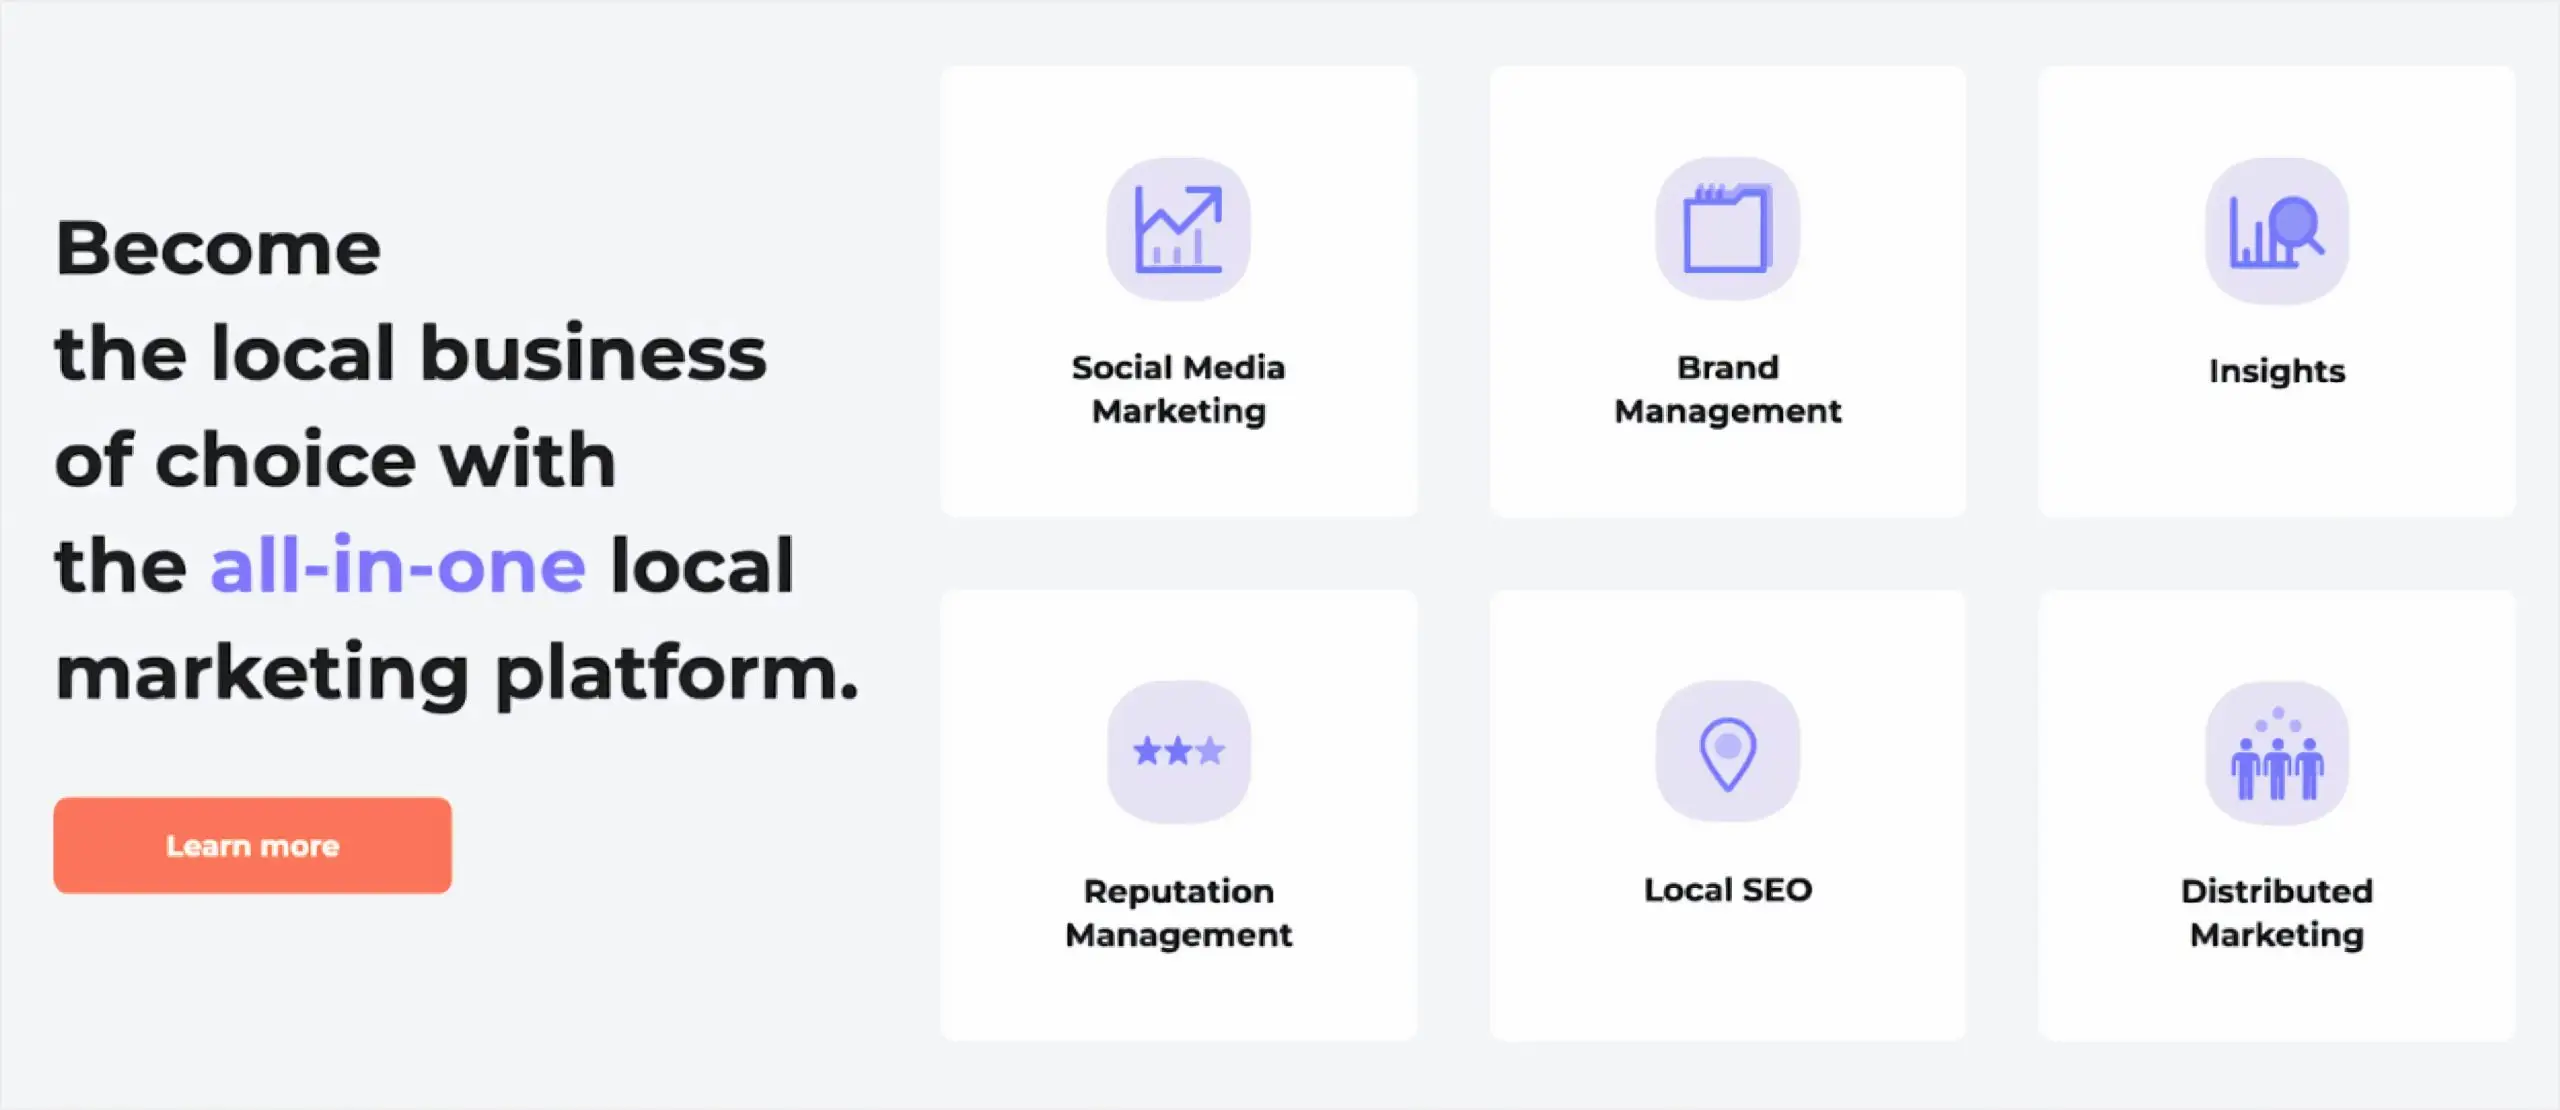
PromoRepublic is one of the best marketing dashboards. It’s an all-in-one solution that helps businesses manage their marketing efforts across channels and all locations. The platform enables businesses to solve a wide range of marketing tasks such as:
- Brand management
- Reputation management
- Social media management
- Distributed marketing
- Local SEO
- Insight-driven marketing
With PromoRepublic, you’ll be able to get a centralized view of your local marketing performance via a convenient digital marketing reporting dashboard with data gathered from various channels to know what metrics to improve and what changes to make in your current strategy to achieve the desired goal and make smart business decisions with confidence.
Pros:
- Scheduling automation
- Saved post functionality
- Content ideas and suggestions
- Built-in ready-to-use templates
- A diverse image library
- Graphic editor
- The approval system
- Effortless reporting
- A detailed analytics dashboard
- Free educational resources
Cons:
- Could use more integrations with third-party apps
Feel free to book a demo to see PromoRepublic in action.
2. Google Data Studio – marketing analytics dashboard
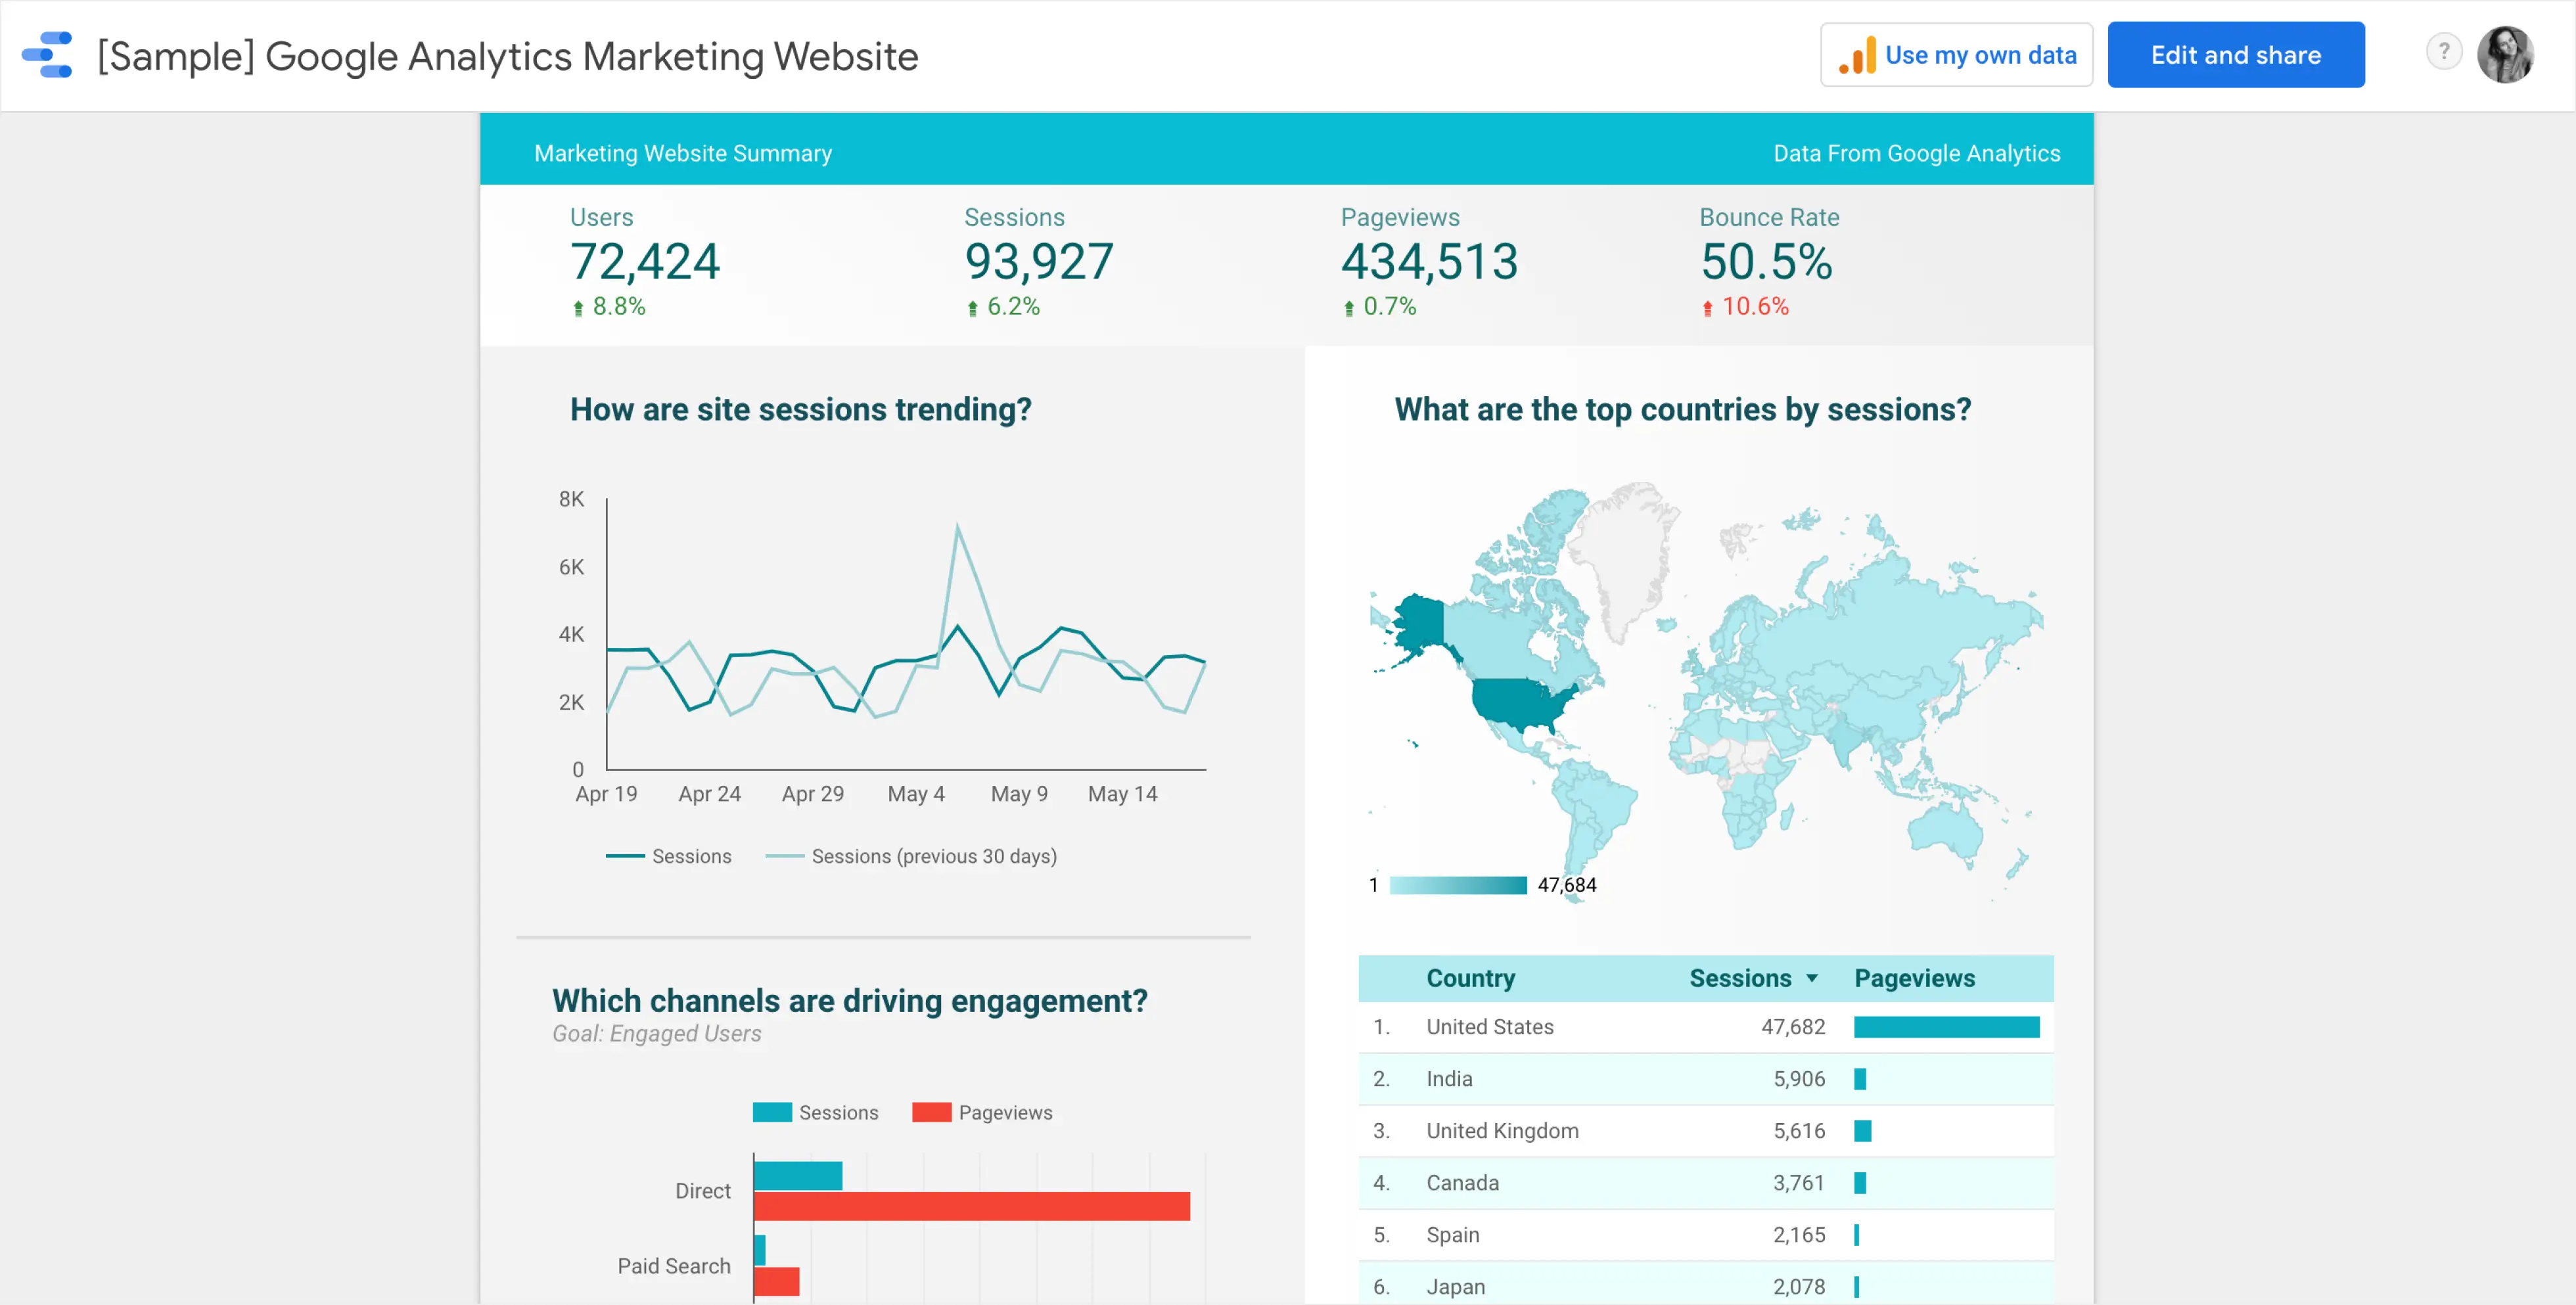
Google Data Studio is a marketing analytics dashboard designed to help analysts create comprehensive reports based on various data sources. The solution brings together information obtained from Google Analytics, Google Search Console, Google AdWords, Google Sheets, Youtube, etc. You can also glean data from other third-party connectors like Amazon Seller Central, Facebook Ads, Mailchimp, etc.б but this function is a paid one. Users can also choose how they want the data to be visualized.
Pros:
- Many visualization tools
- A variety of data sources to connect
- The ability to create calculated fields using data
- Easy sharing
Cons:
- The layout and formatting options are limited
- Cannot be used on-premise
- Excel can’t be imported
- Can be difficult to use for non-technical people
- Not enough template reports
3. Klipfolio – online platform for creating and sharing real-time business dashboard
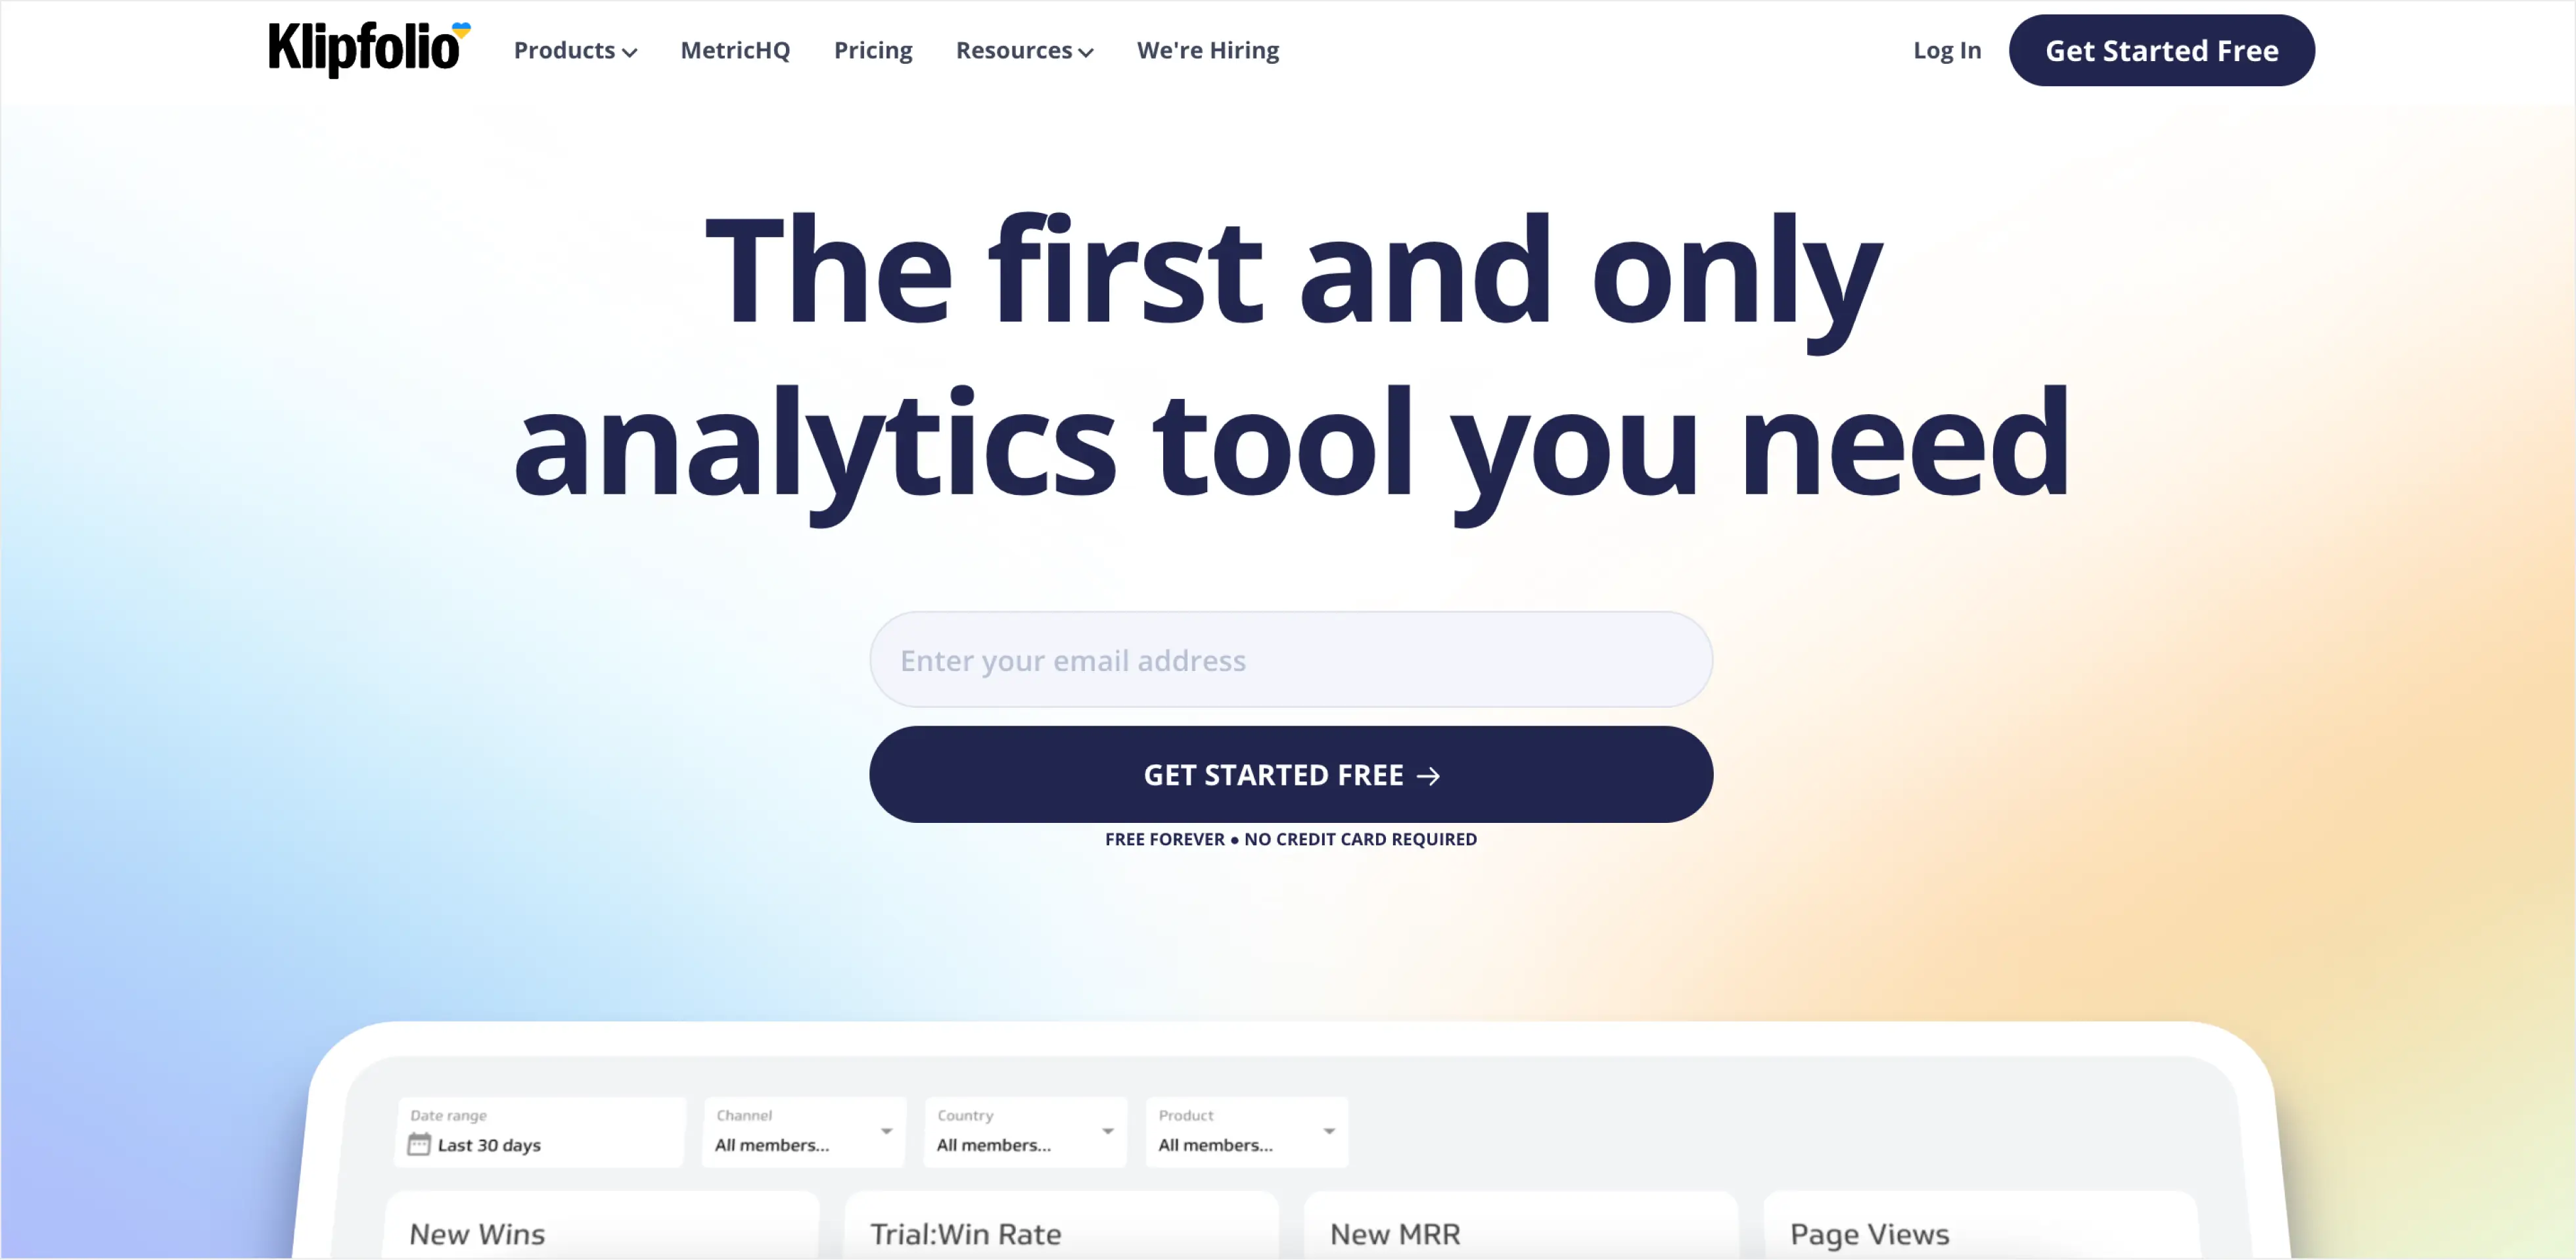
Klipfolio is an online platform for creating and sharing real-time business dashboards. It is focused on improving team efficiency and allows users to create their own visualizations from data mashups. It helps you gather better analytics for your business and automate reports with data from multiple marketing channels — be it Facebook, LinkedIn, Instagram, Mailchimp, Google Analytics, etc.
Pros:
- Easy creation of complex dashboards
- A variety of dashboard templates
- User support and documentation
- Easy user interface
- Easy integration with business services like Mailchimp, Salesforce, Google Drive, HubSpot
Cons:
- Some instructional materials are outdated
- No ability to display timelined data in a quarterly increment
4. Sisense – marketing dashboard tool
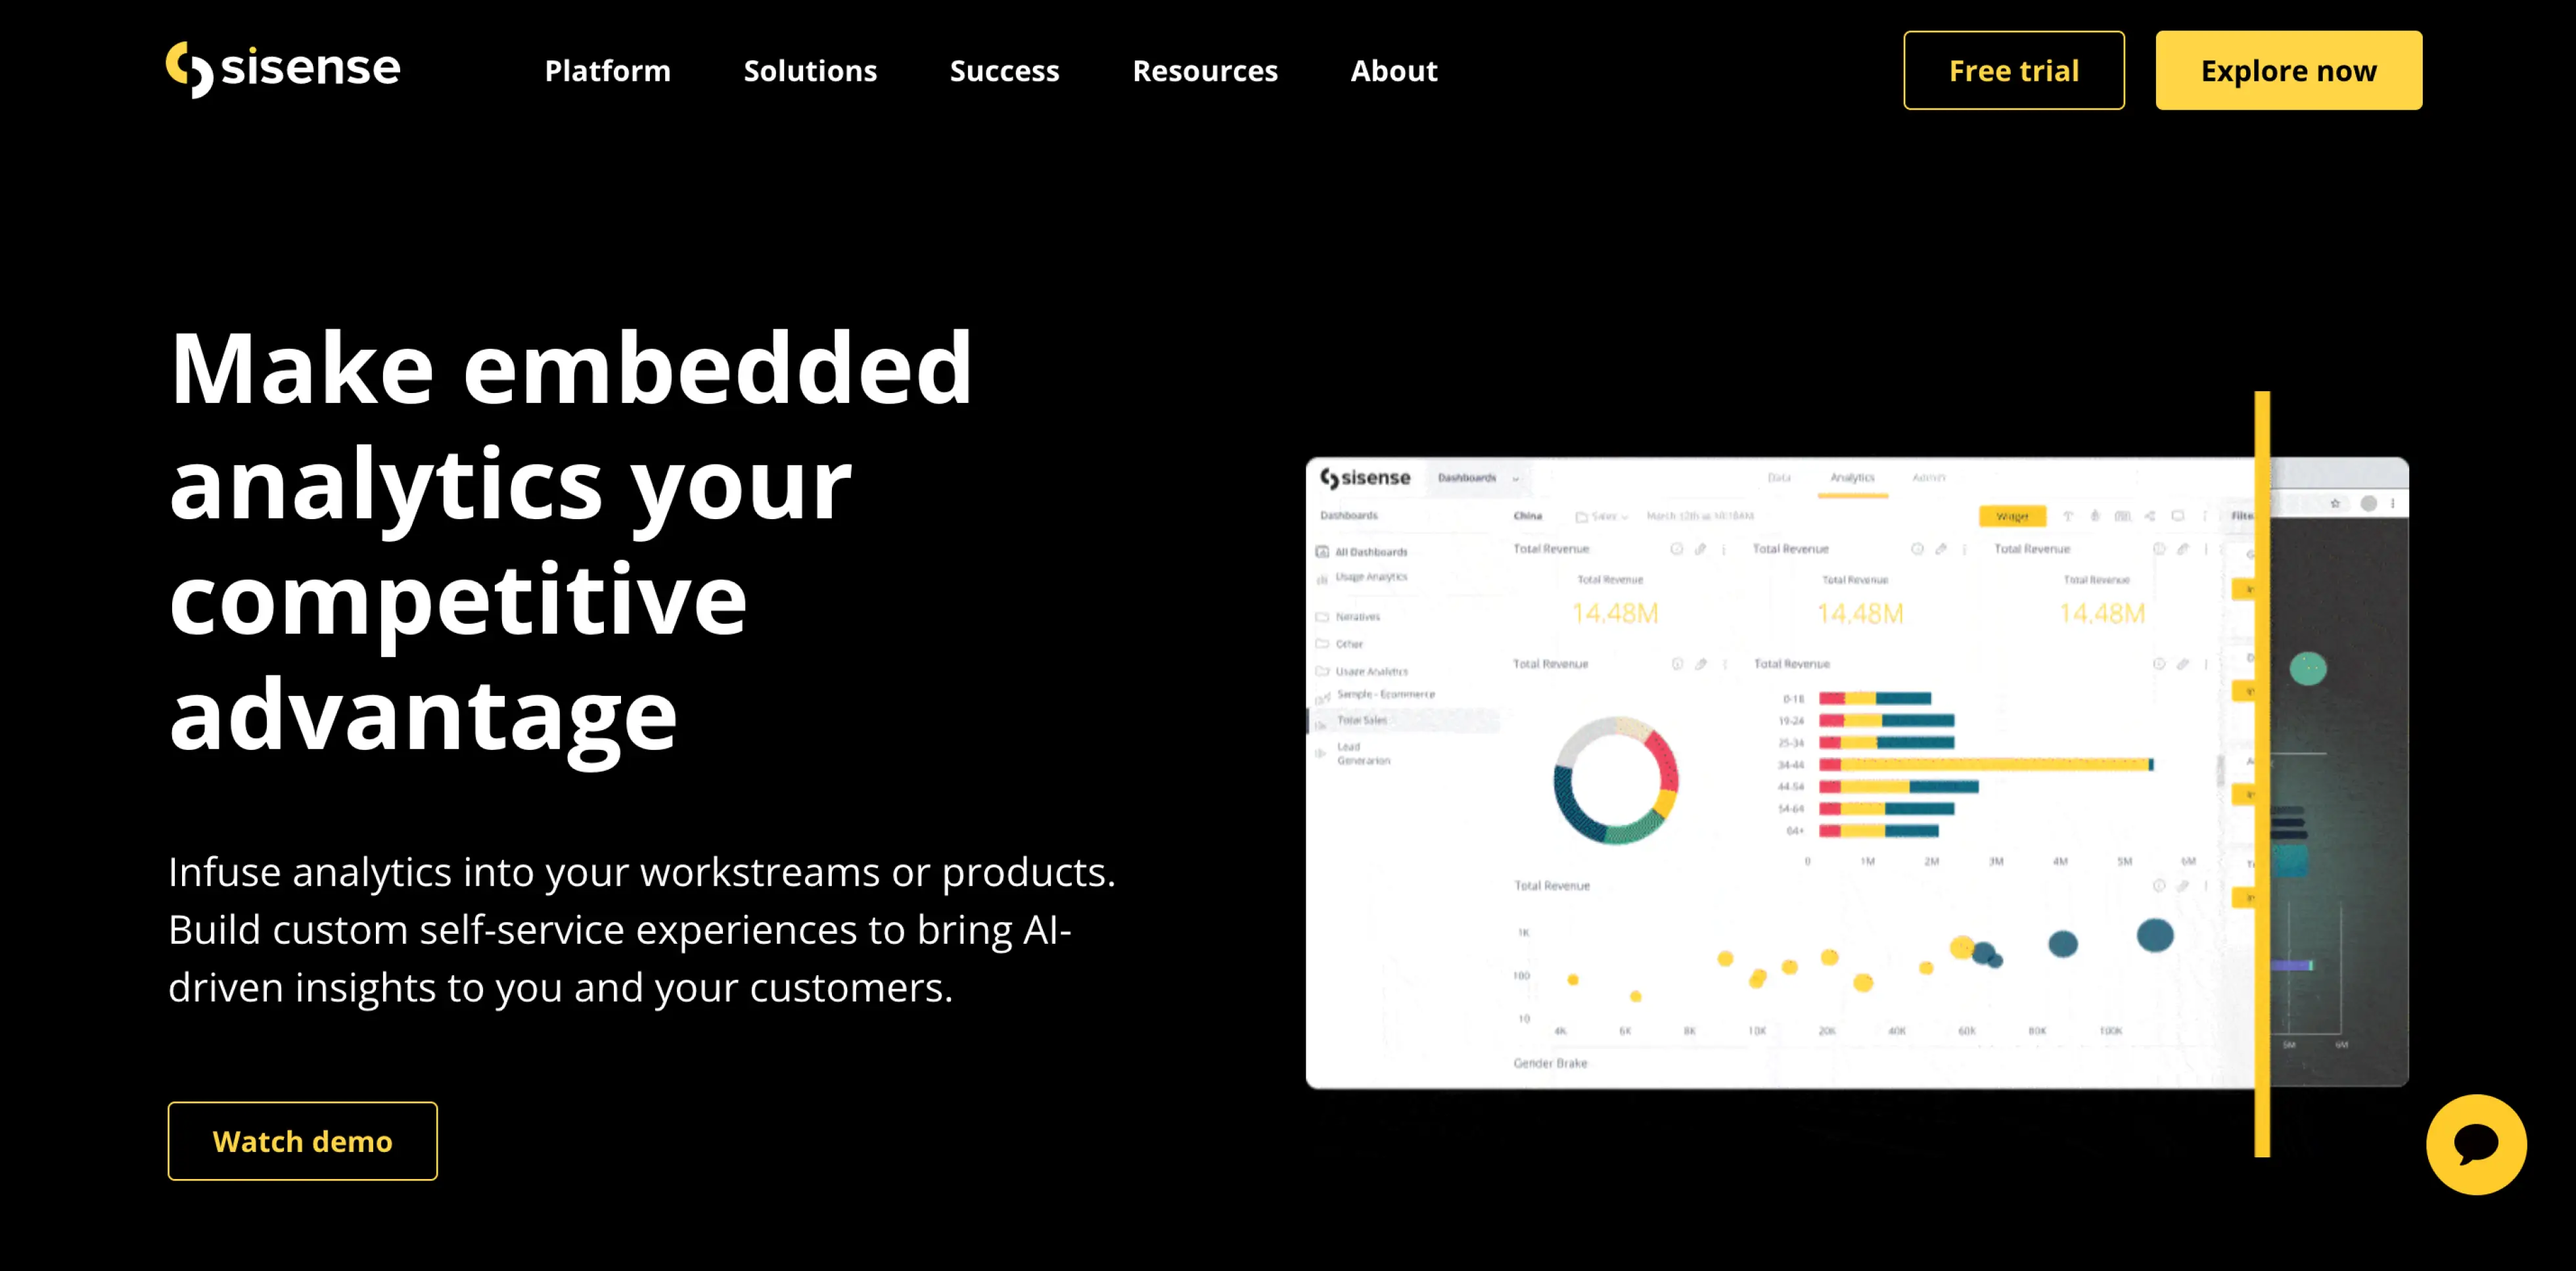
Sisense is a reliable marketing dashboard tool. It is a cloud analytics platform that allows businesses to embed analytics into products or workflows and provides dynamic insights using machine learning to help drive faster decisions for businesses and their customers. The platform can be used for both code-first and no-code workflows.
Pros:
- Dashboard builder with various widget options
- Forecasting and segmentation
- Custom visual
- Geo analytics
Cons:
- Server slowness
- Not enough training resources
- High price for fusion analytics
5. Moz Pro – SEO and data management solution
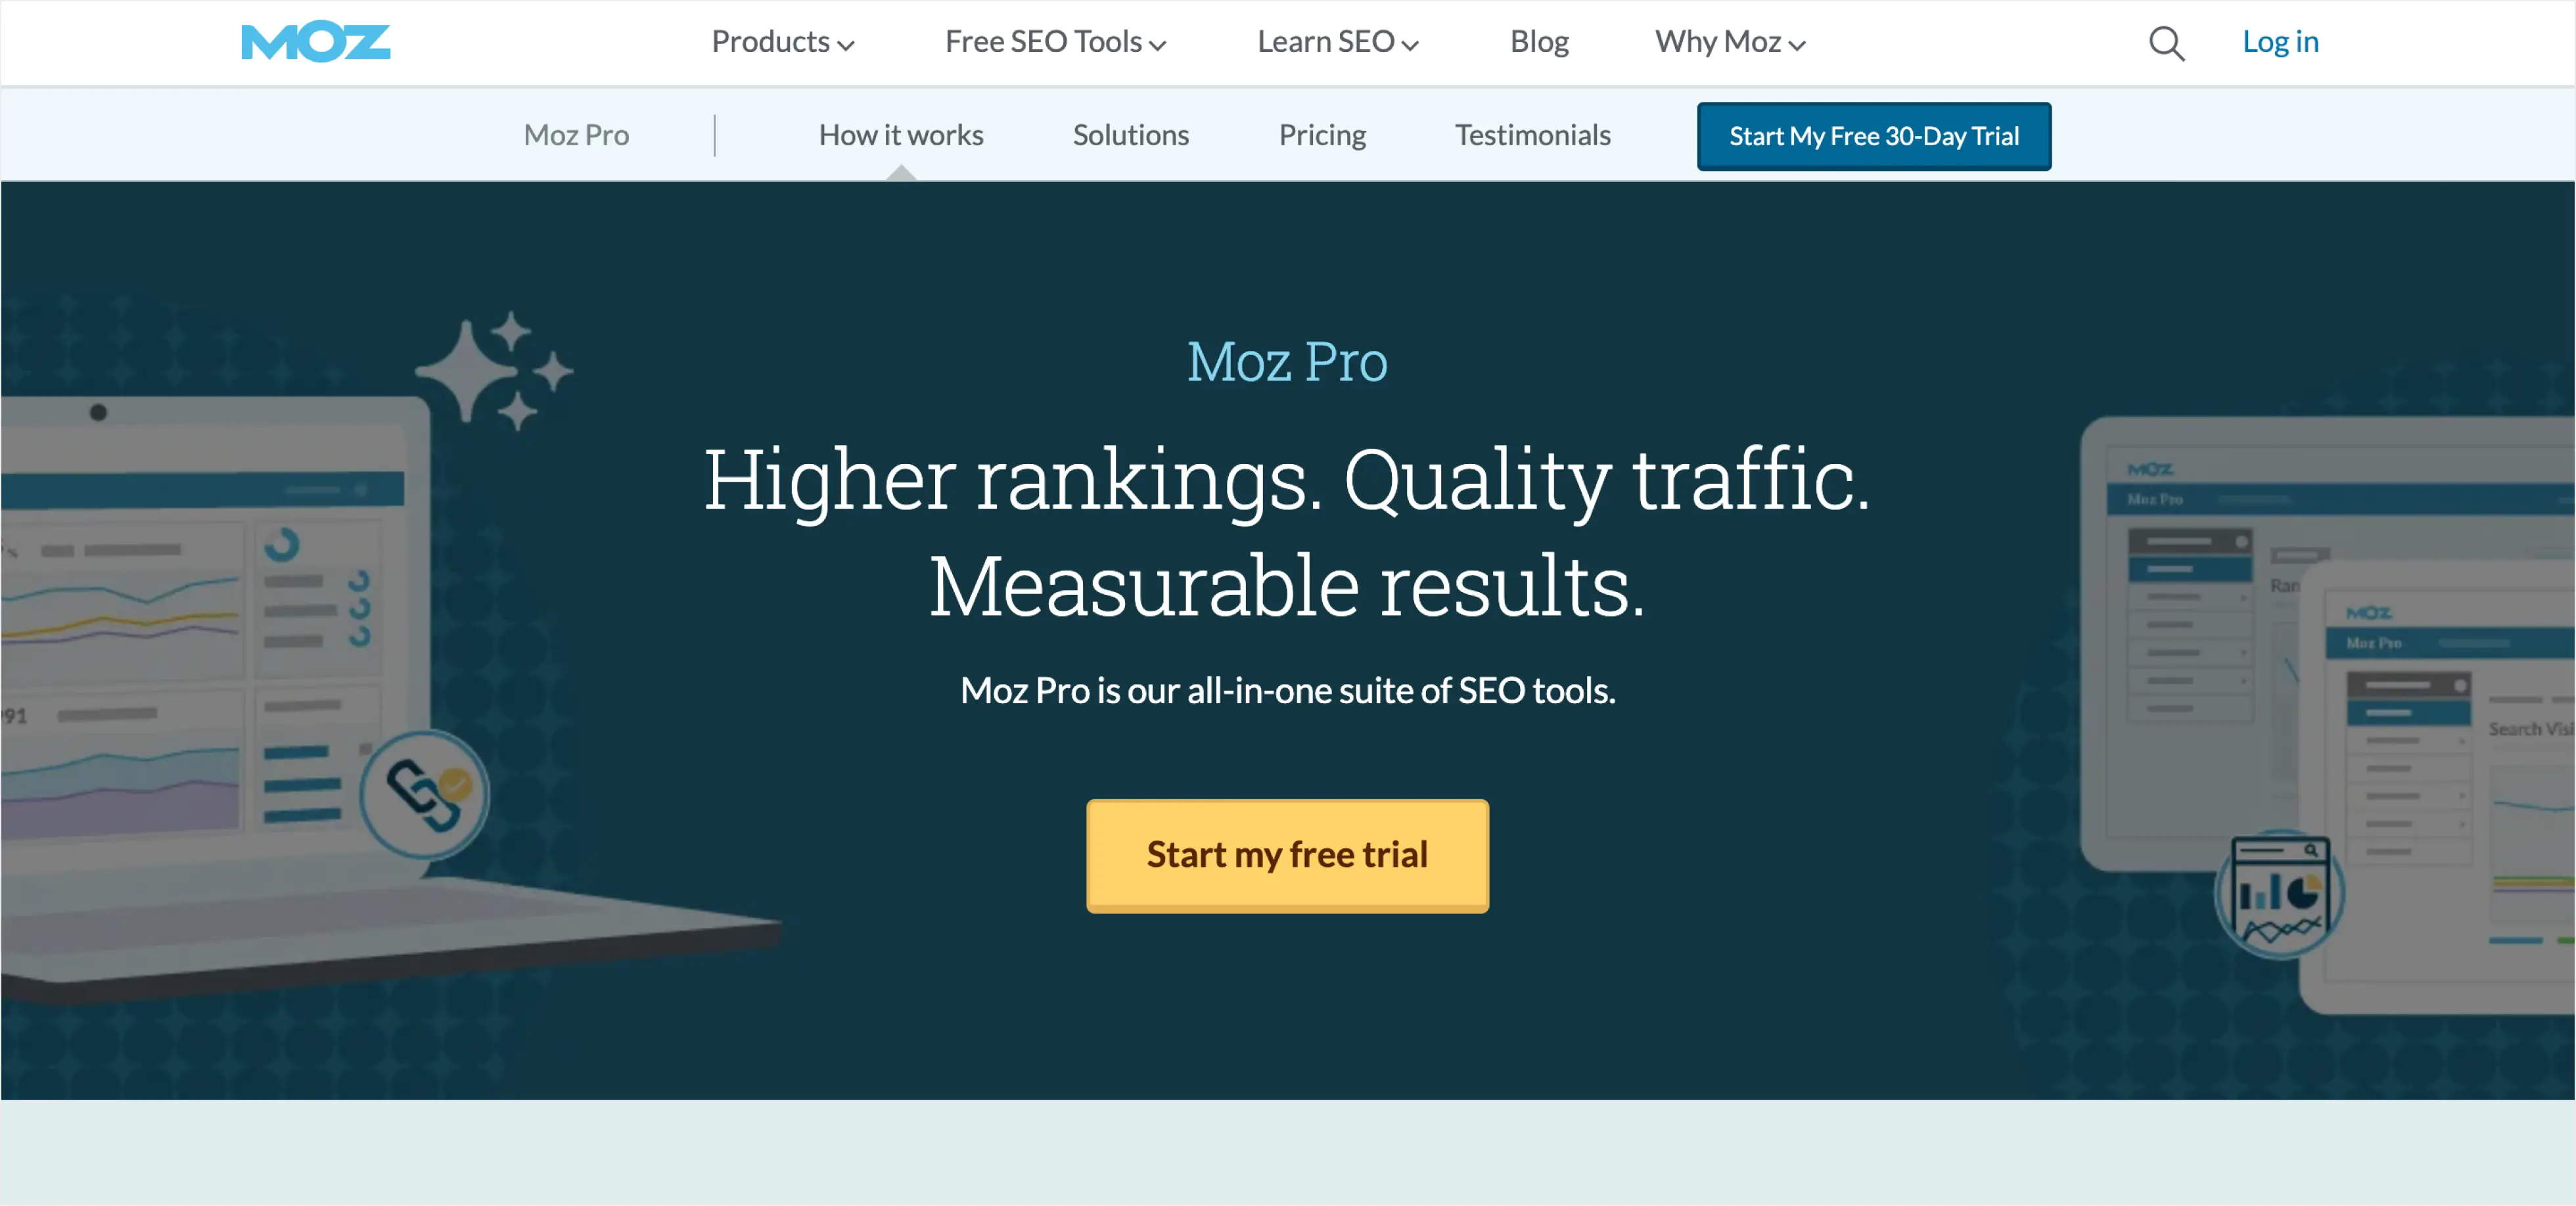
Moz Pro is a popular SEO and data management solution businesses of all sizes can use to get more traffic, improve rankings, and ensure better visibility in search engine results. It allows users to track their website’s health and analyze the overall SEO performance. With Moz Pro, businesses can also see the outcomes of their competitors’ SEO efforts, which helps companies uncover their competitive edge to reach top positions.
The platform’s advanced SEO features enable businesses to stay relevant and save time and costs.
Pros:
- Deep crawling of your website
- Link opportunities generation
- Identifying top ranking keywords
Cons:
- Not intuitive user experience
- Information cannot be represented as a graph
- High price for a limited feature set
6. DashThis – marketing dashboard tool
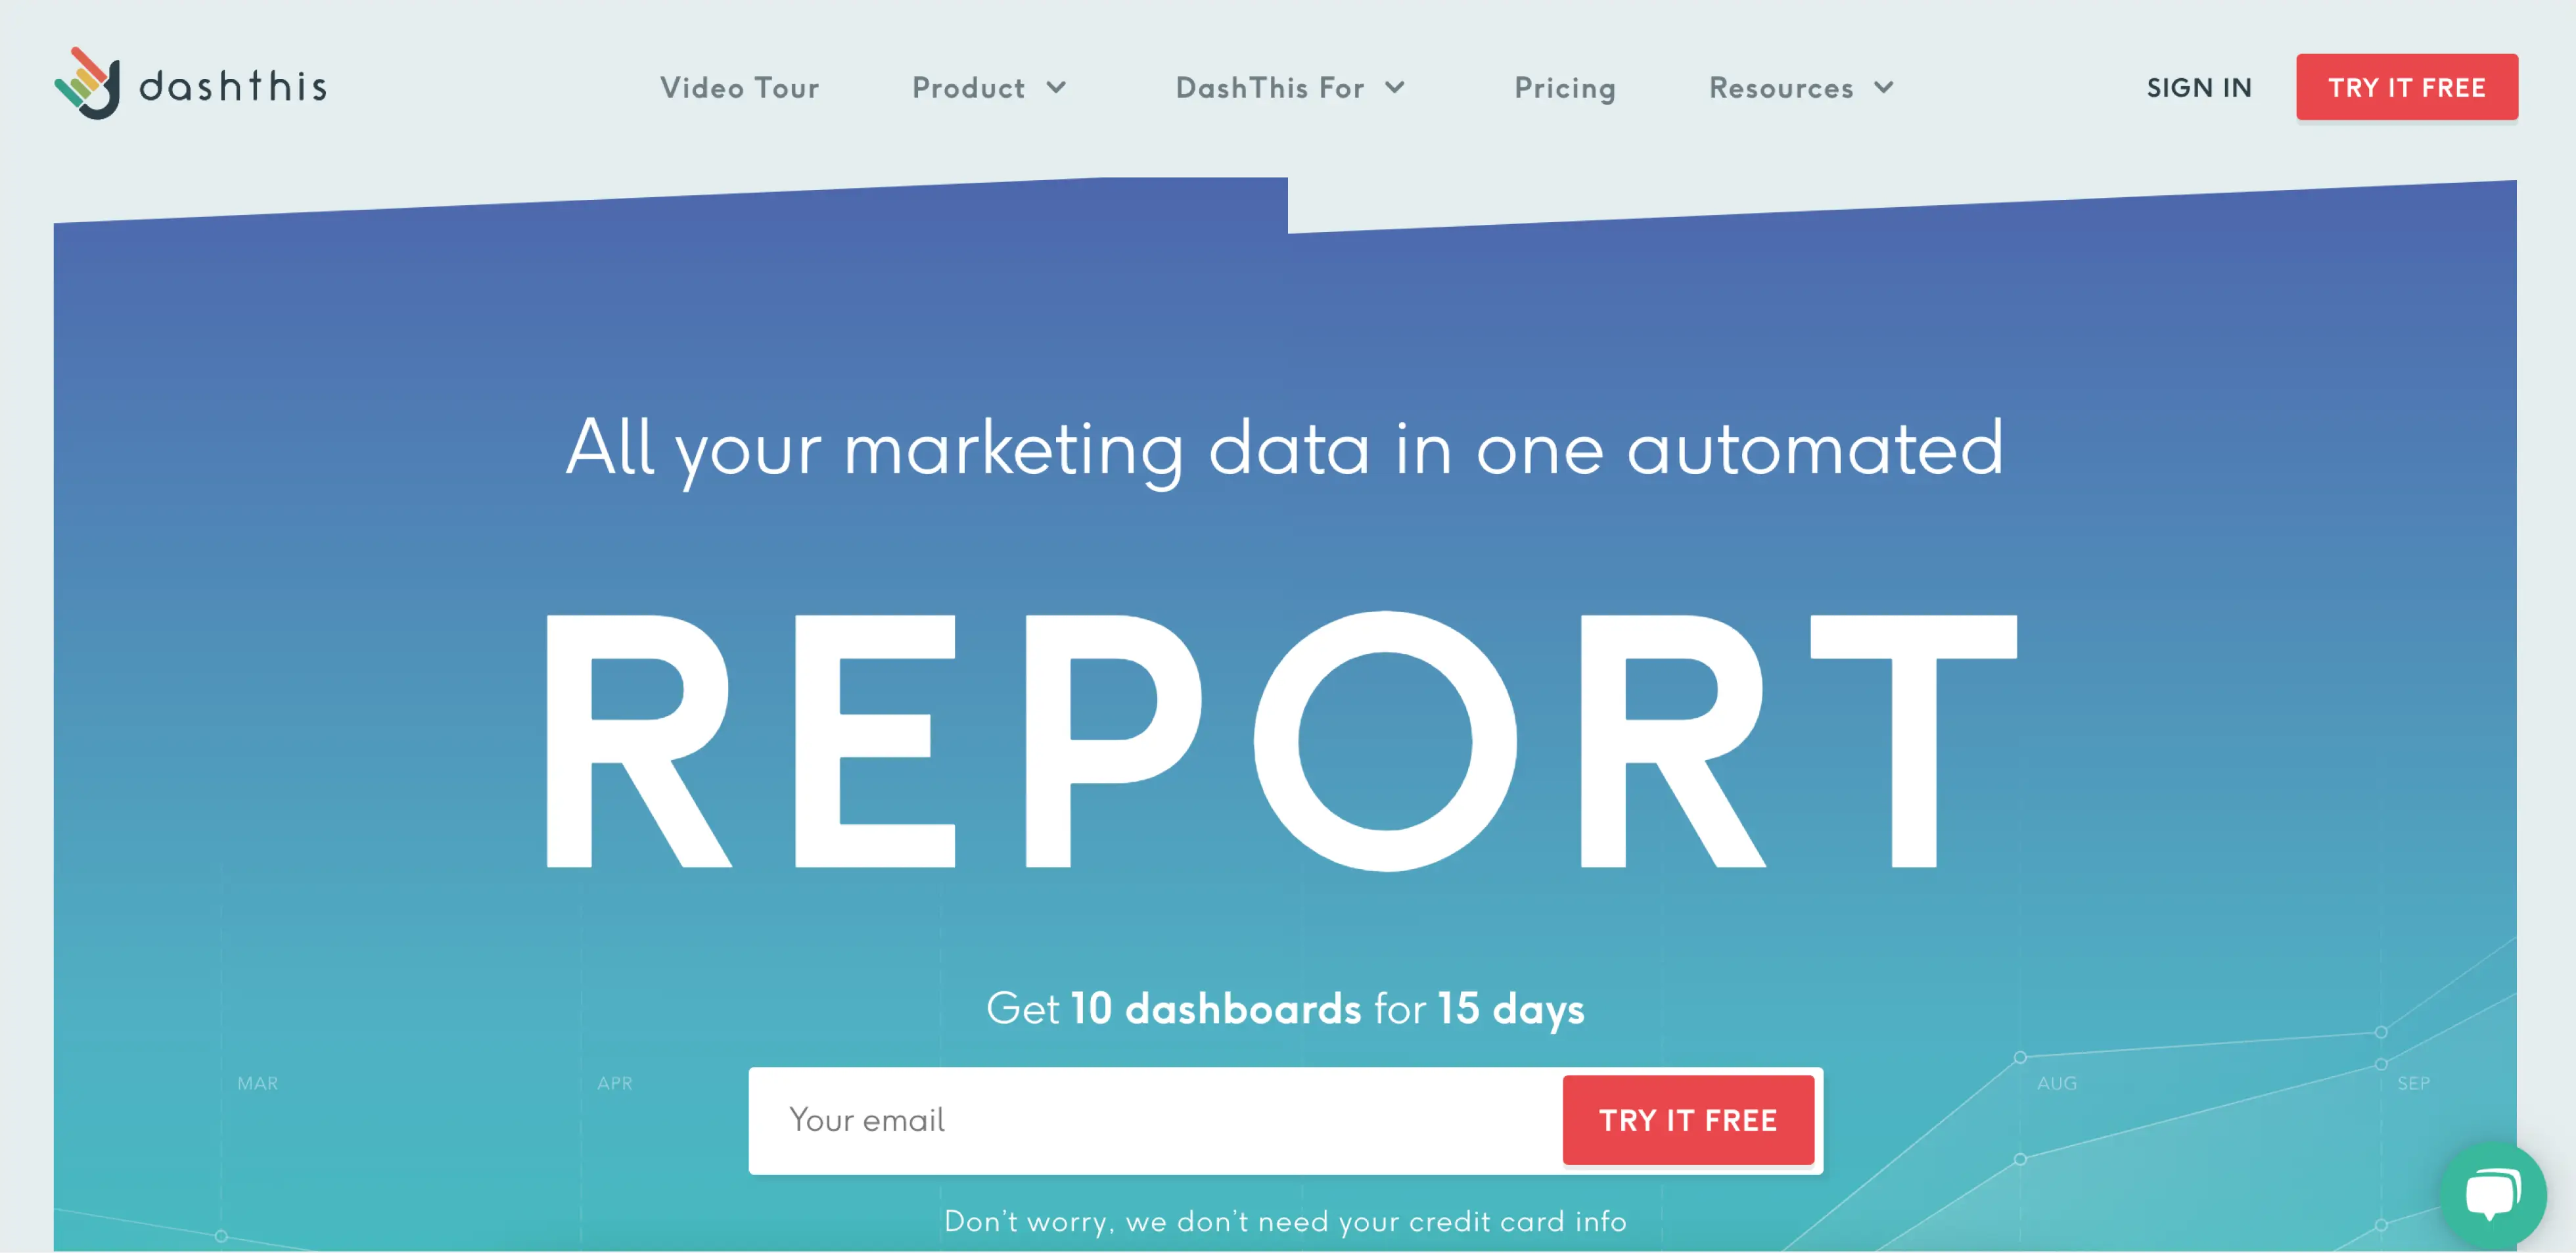
DashThis is a marketing dashboard tool for creating reports for analytics, PPC, as well as SEM and SEO purposes without complicated “unnecessary” options. It integrates with more than 30 data sources such as Google Analytics, Google Search Console, Google Ads, Facebook, LinkedIn, SEMRush, Ahrefs, and many more. Besides, DashThis offers users a CSV File Manager so they can add any other data they might want to see on their dashboard.
Pros:
- Intuitive and user friendly
- Comprehensible reporting
- Ability to analyze data obtained prior to connecting the platform
Cons:
- The complicated process of changing data sources
- Lack of customization
- Not enough options for pricing plans
- No dynamic charts, transitions, and animations
7. Databox – online marketing dashboard tool
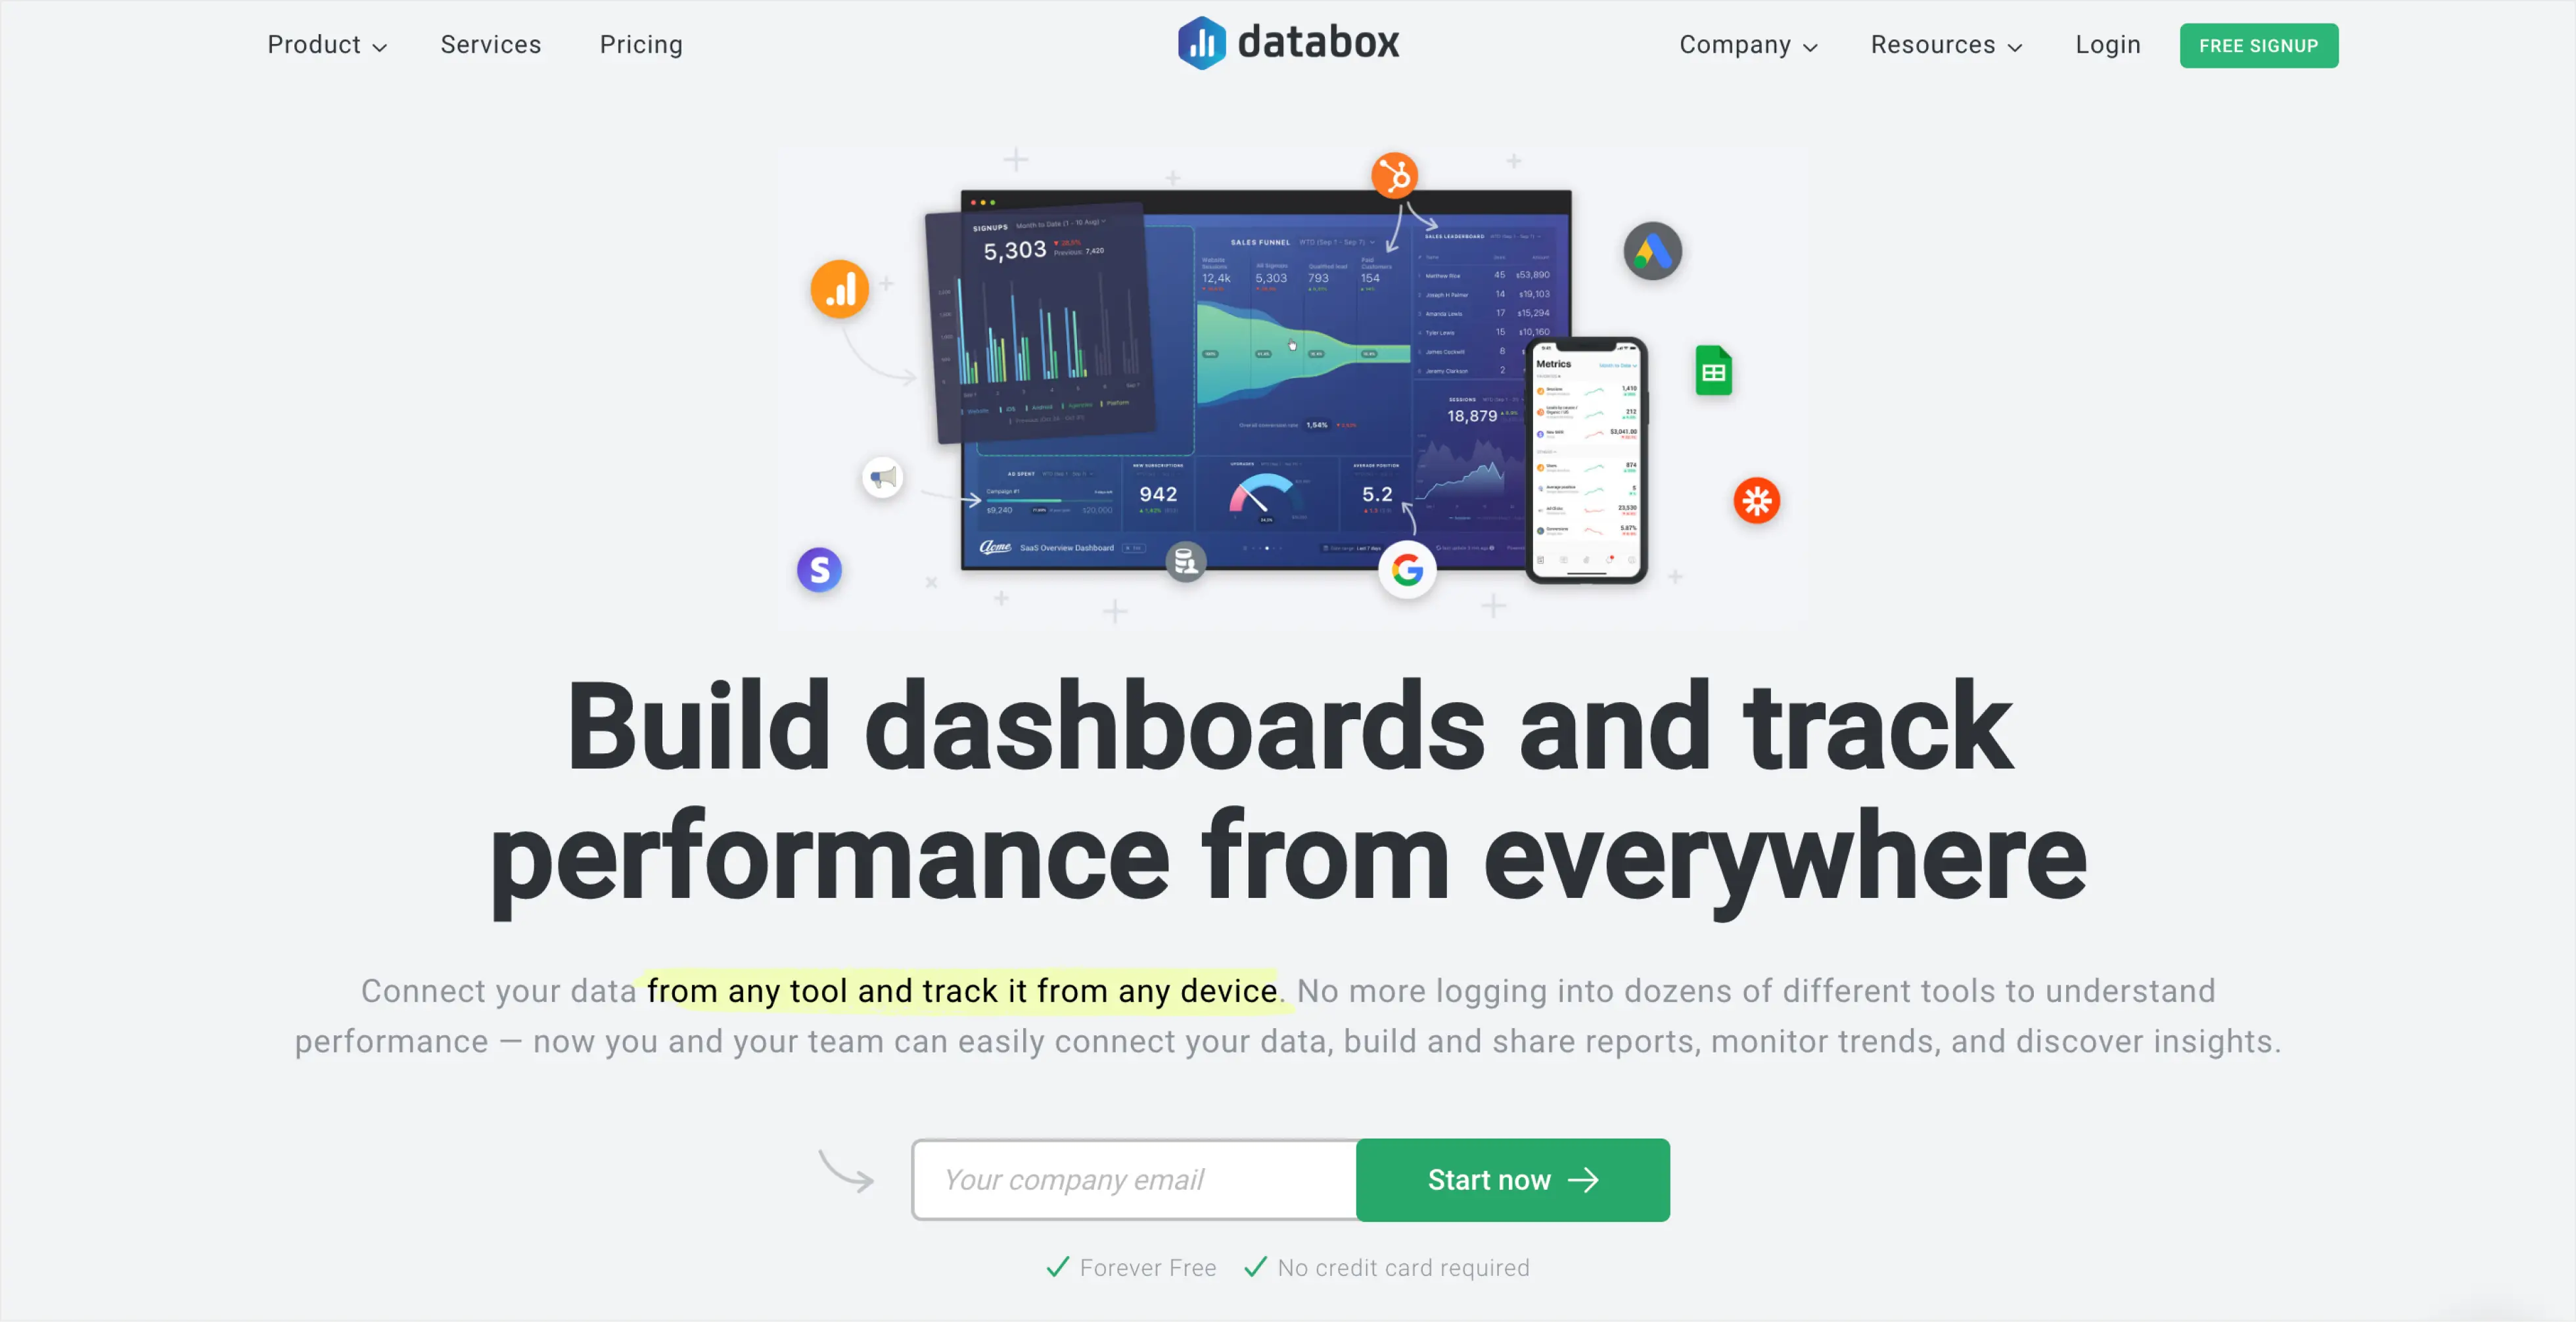
Databox is another online marketing dashboard tool designed for businesses to consolidate all necessary metrics from various sources in one place. With this solution, you can easily monitor your progress and make insight-driven decisions.
Databox allows you to create dashboards using the drag-and-drop editor, with the ability to customize the appearance. Users can control additional parameters for each metric such as changing time intervals, currencies, and chart formats.
Pros:
- Easy to set up
- Scheduling snapshots
- A wide range of data visualization options
- Ability to create custom metrics
Cons:
- No date ranges for reports customization
- Lack of integration with several digital marketing tools
- Limited visual customizations
8. Looker – browser-based business intelligence software
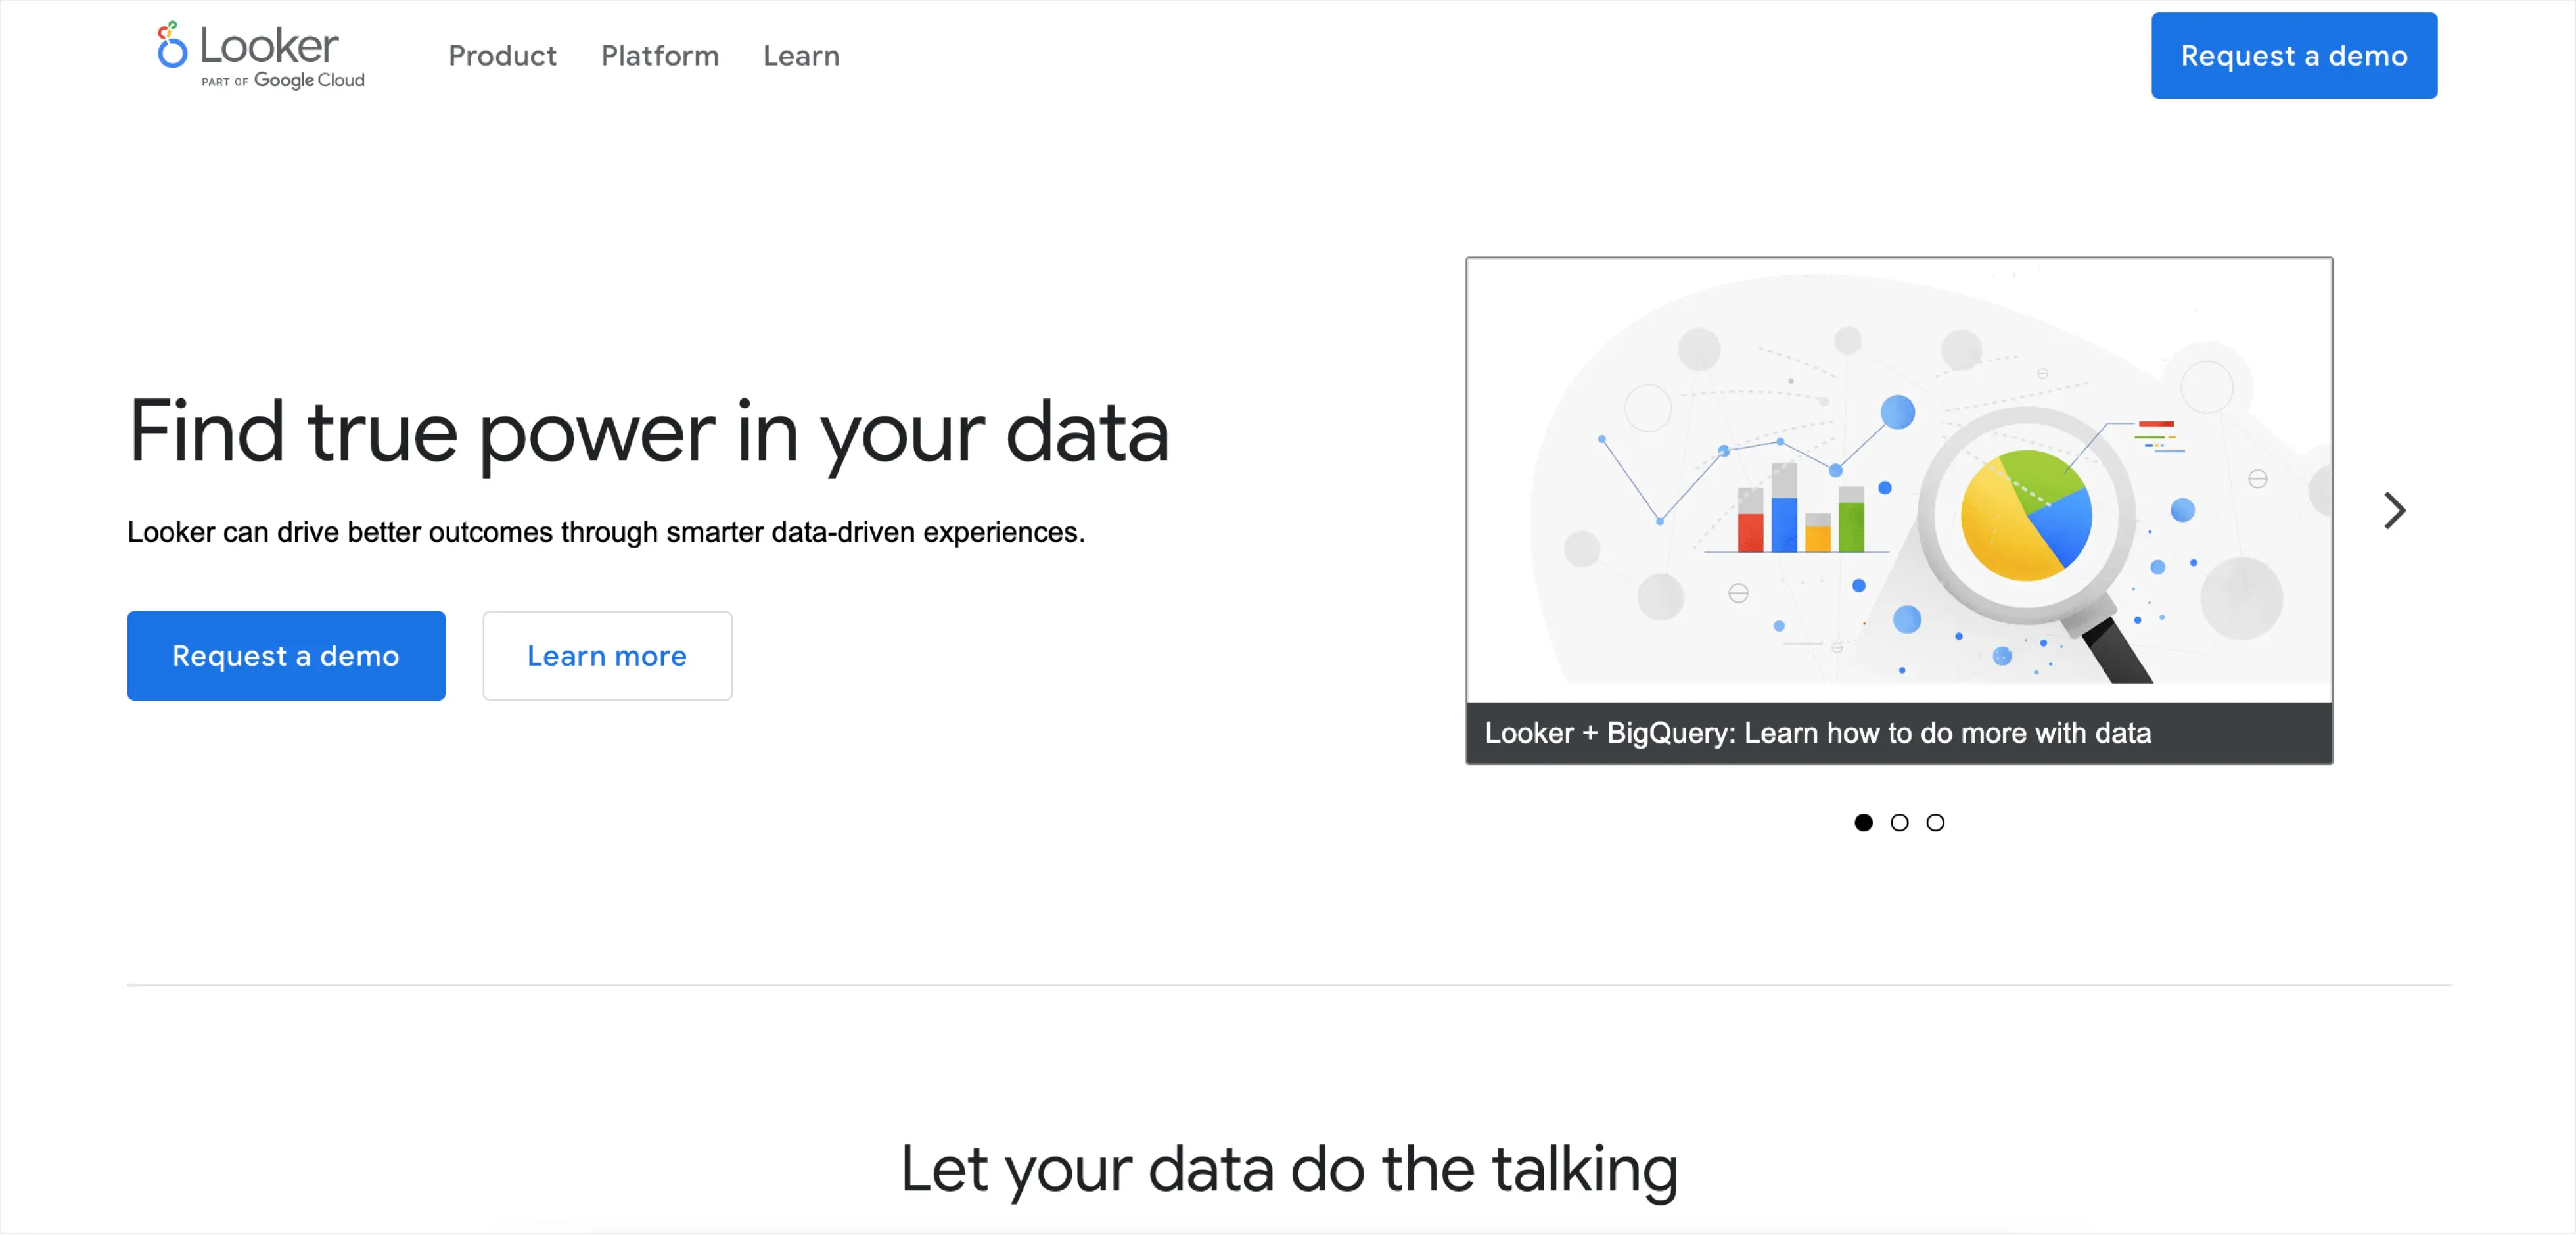
Looker is browser-based business intelligence software and a big data analytics platform that helps you easily and consistently research, analyze, and share business analytics in real-time. The solution is massively beneficial for businesses in determining how effective their marketing strategy is via custom dashboards that allow companies to track such metrics as clicks, subscriptions, conversions, completed sessions, and so on. Looker offers a wide range of templates to make data visualization and report generation easier and faster.
Pros:
- Powerful data modeling capability
- Custom fields
- Easy data sharing
Cons:
- Limited visualization capabilities
- Works slower than other similar tools
- The mobile app is not intuitive
9. Megalytic – web-based marketing dashboard tool
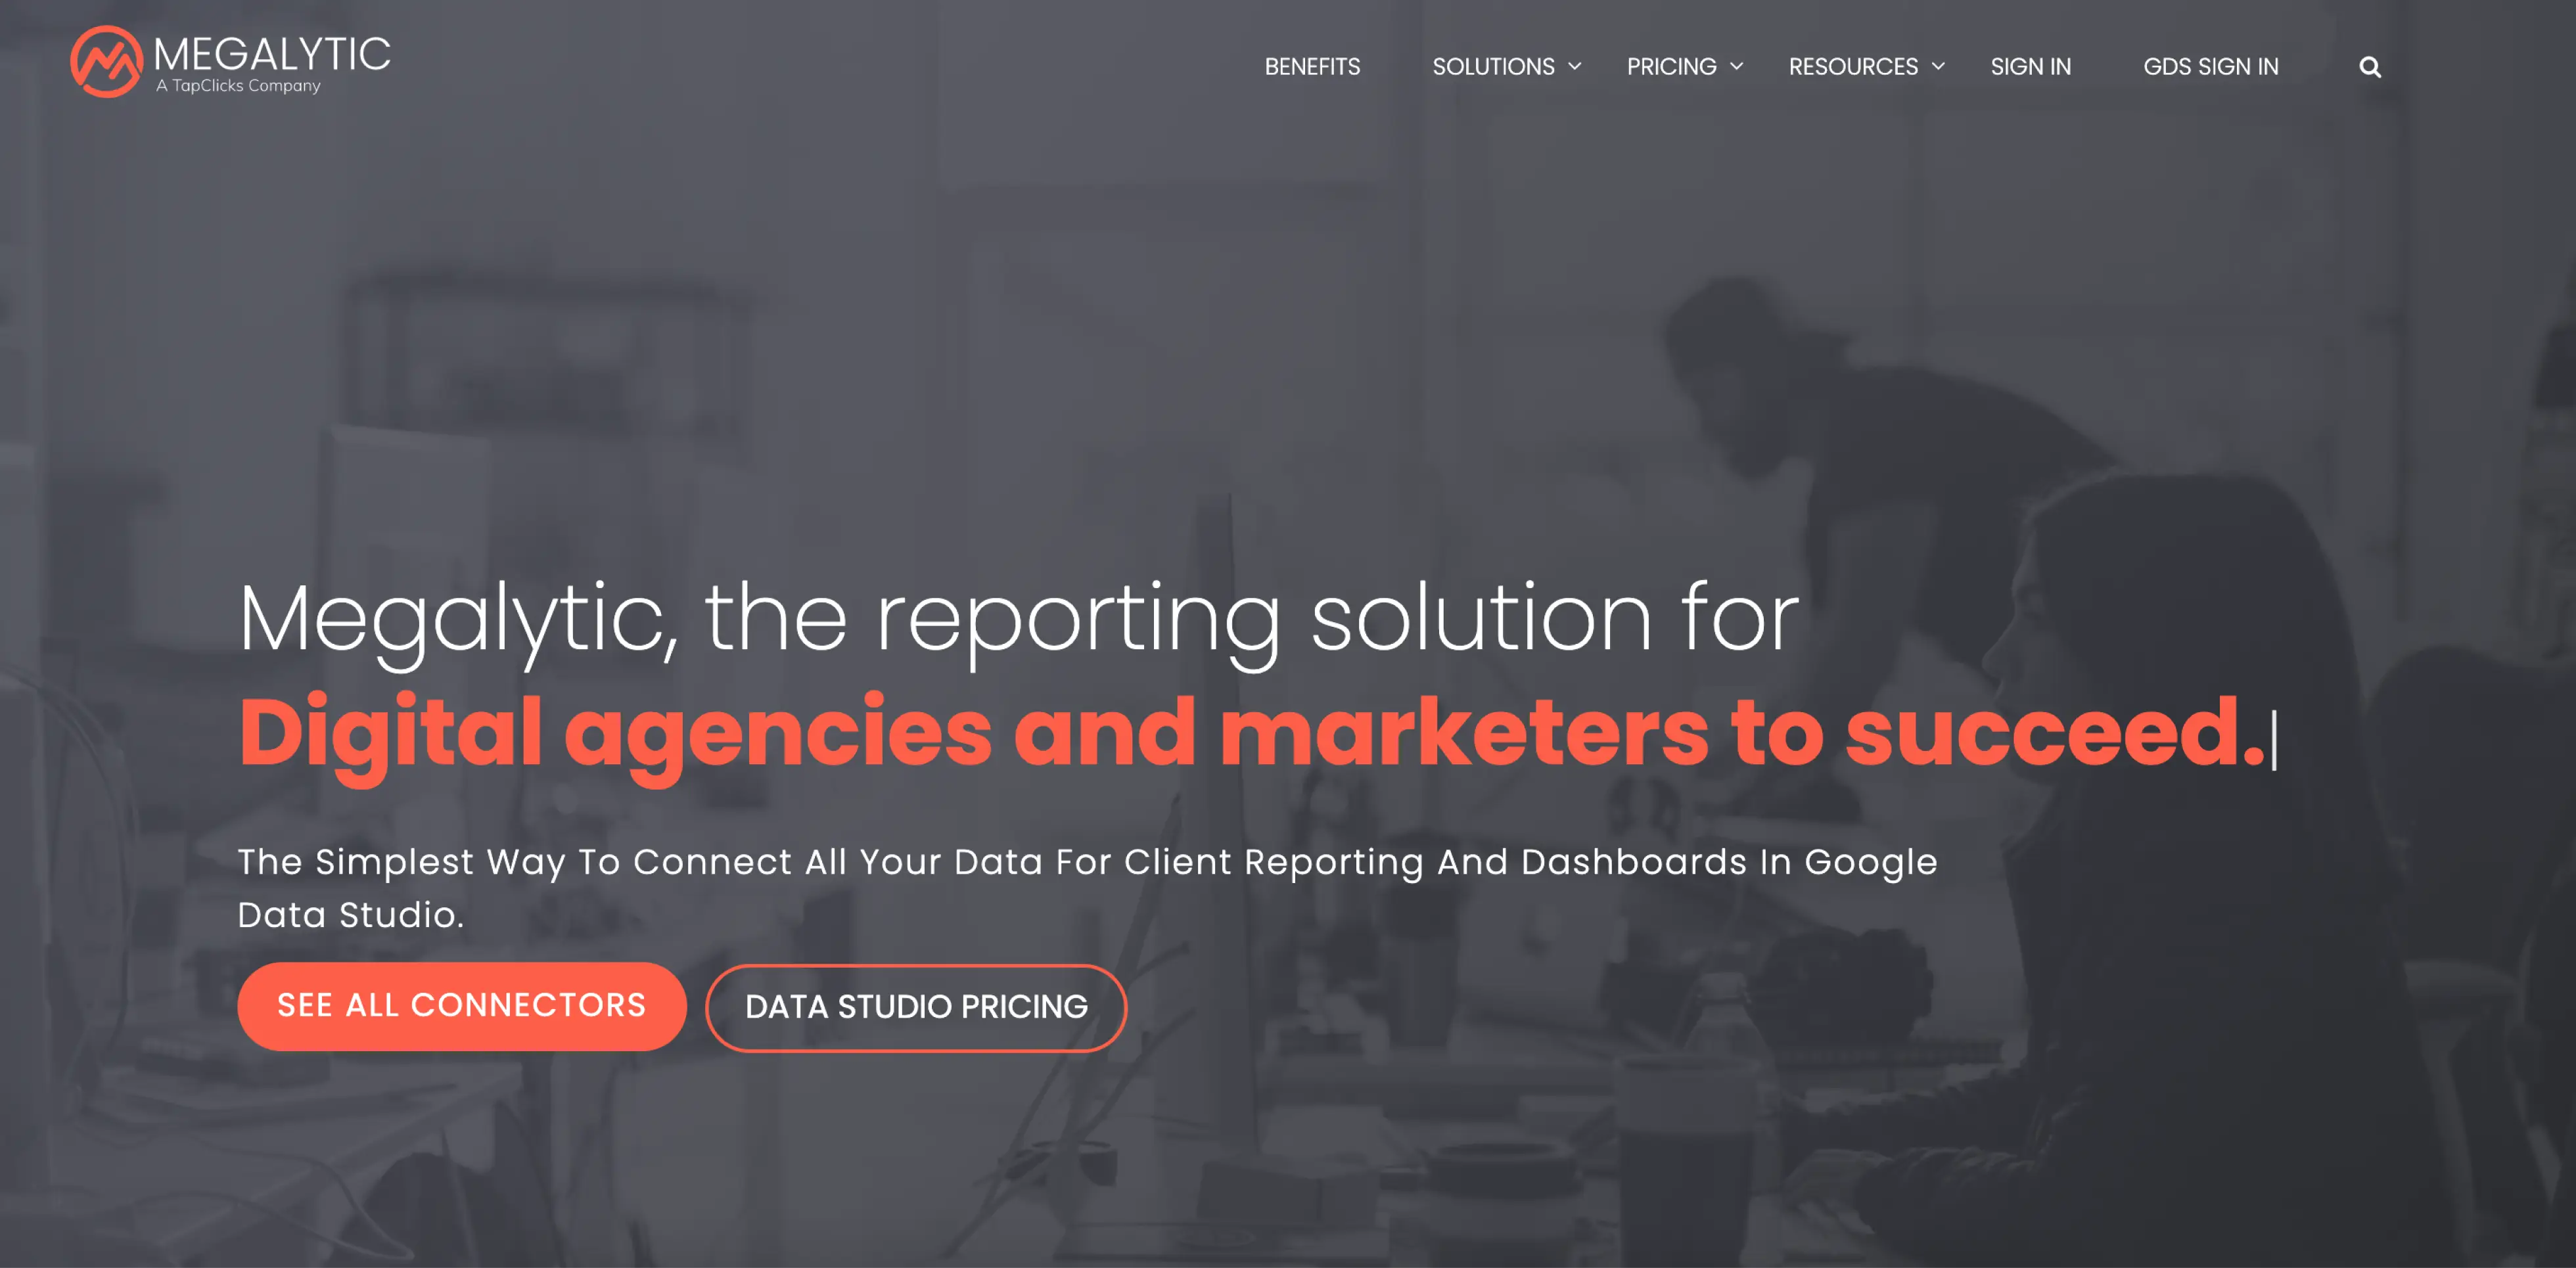
Megalytic is another web-based marketing dashboard tool that gathers data from various sources and transforms them into a variety of formats — from CSV files and traditional spreadsheets to customized graphs, maps, and charts. Users can obtain data from Google AdWords, Google Search Console, Google Analytics, Facebook Page, etc. as well as upload their own data. The solution also offers easy report sharing within the organization to collectively make business decisions based on the gathered insights.
Pros:
- Easy to use
- Reasonable price
- Useful KPI designs
Cons:
- Limited feature set
- No mobile app
- High price
- A limited number of integrations
10. Swydo – marketing digital dashboard software
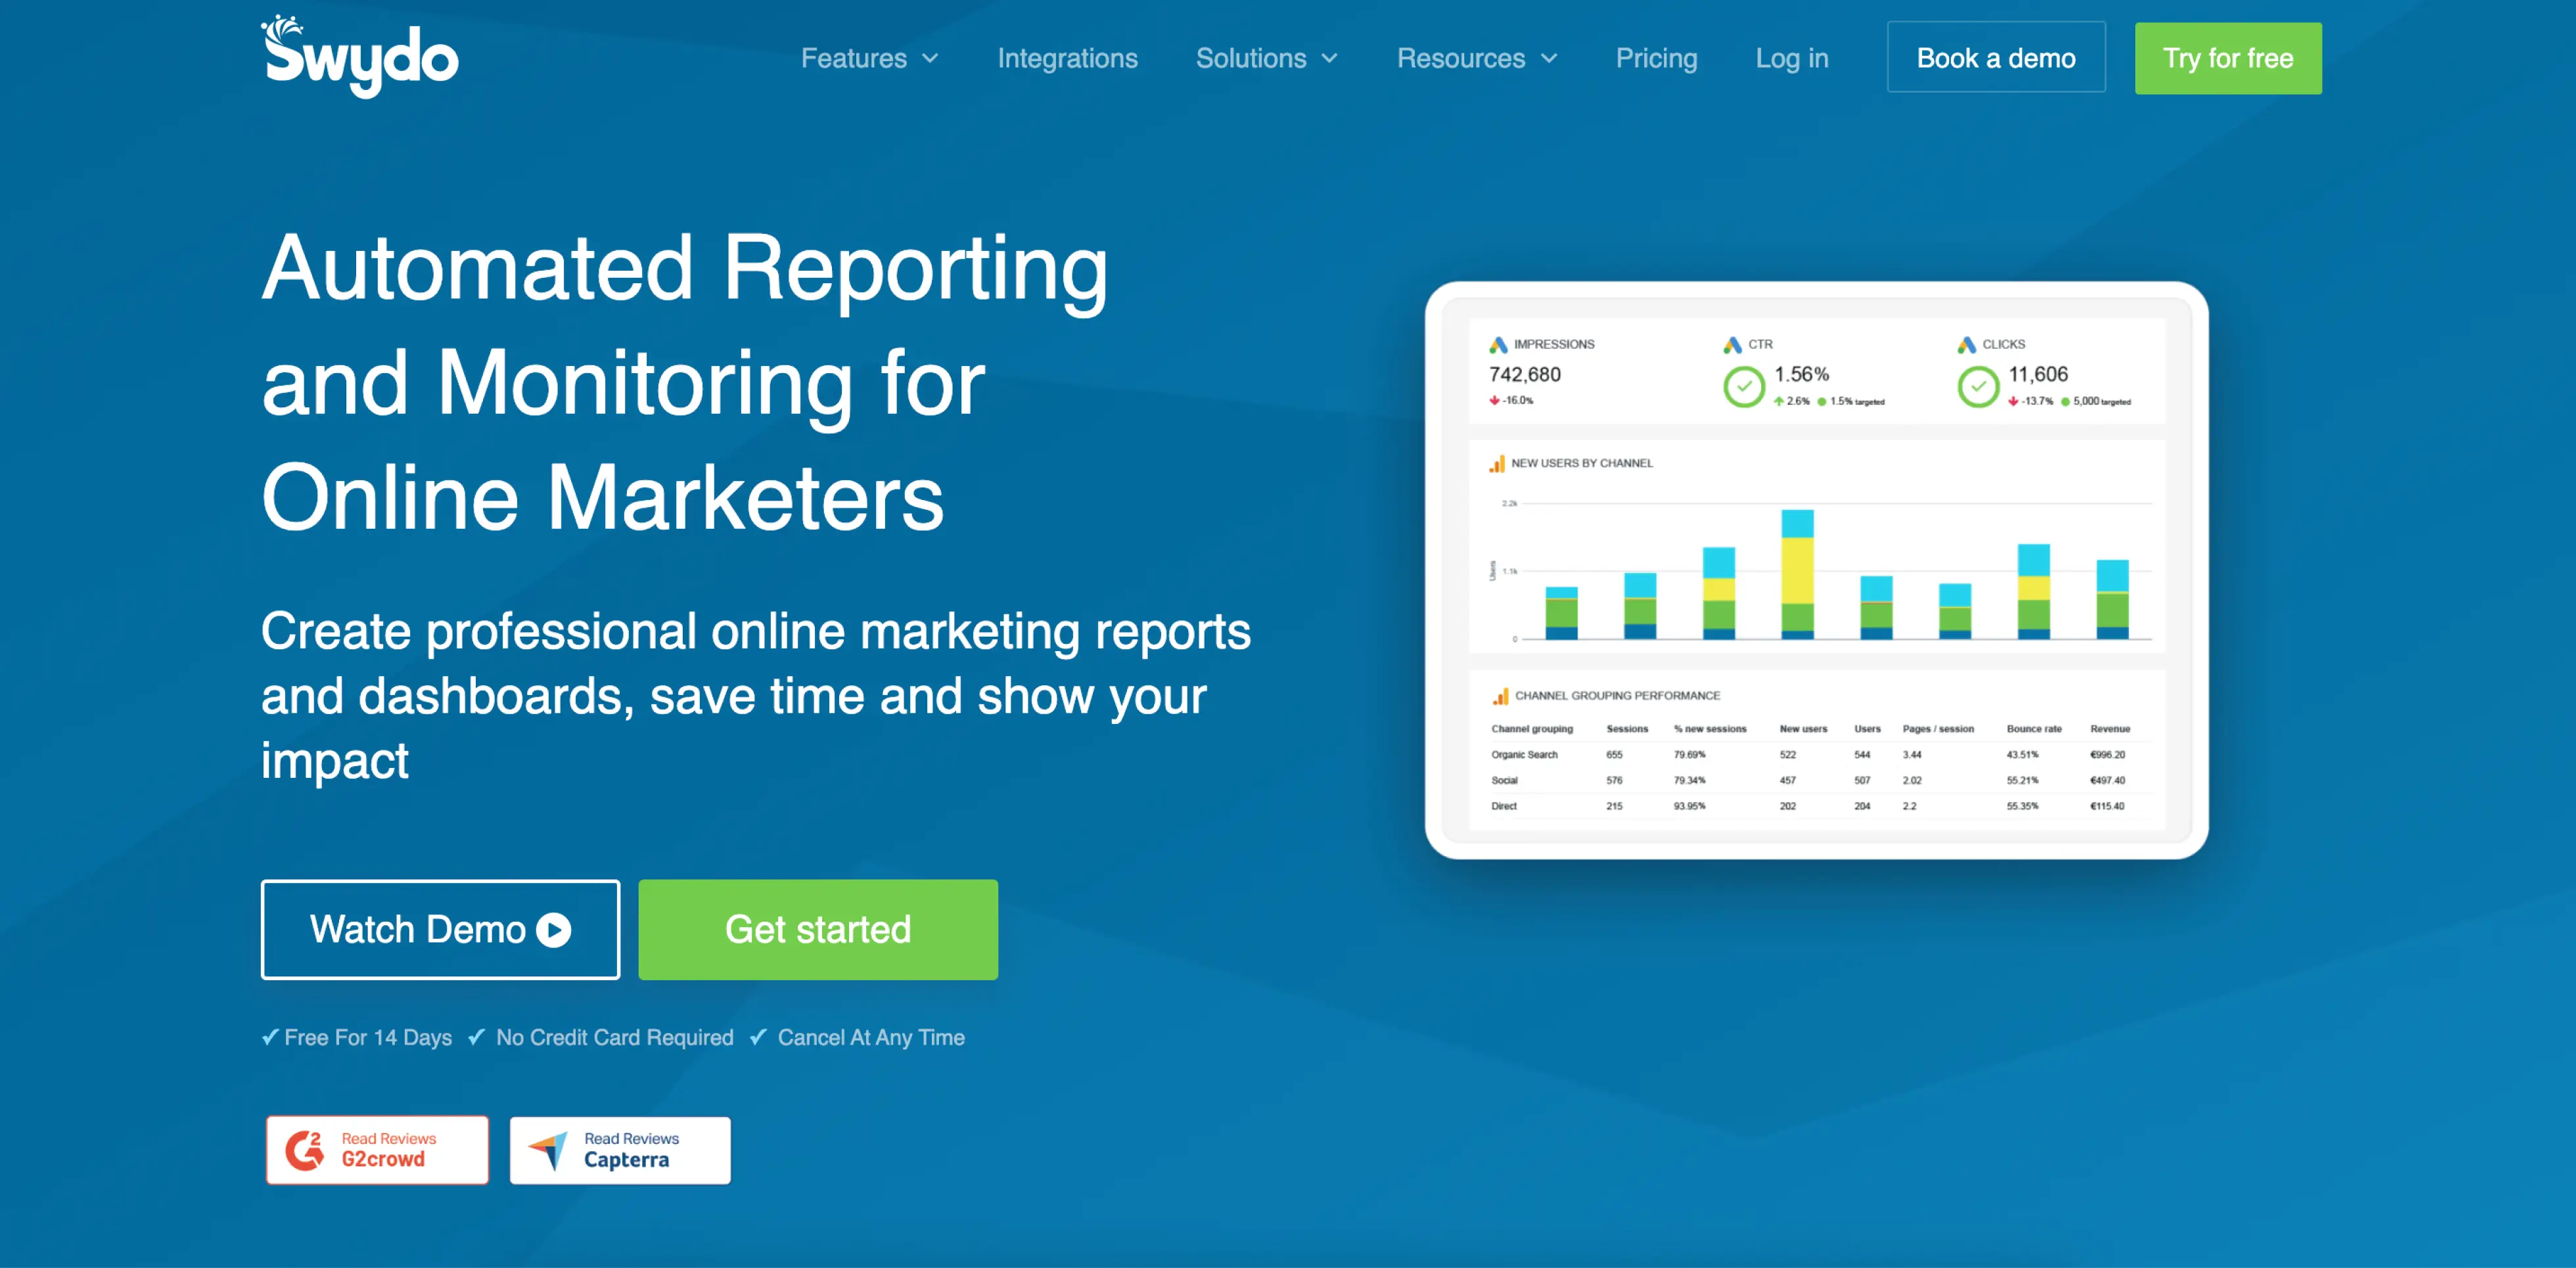
Swydo is marketing digital dashboard software that enables marketers to save money and time on generating reports. It integrates with over 30 data sources, including Google Ads, AccuRanker, AdRoll, Facebook Insights Ads, DialogTech, CallRail, Google Analytics, etc. Swydo allows you to make professional custom reports on any data source to add value to data analysis and gain actionable insights.
Pros:
- Template and customized reports
- Customizable widgets
- Automatic report generation and sending
Cons:
- No OLAP (Online analytical processing) support
- No forecasting capability
- No display of paused campaign statistics
- No local services reporting
11. Domo – platform for connecting and analyzing data
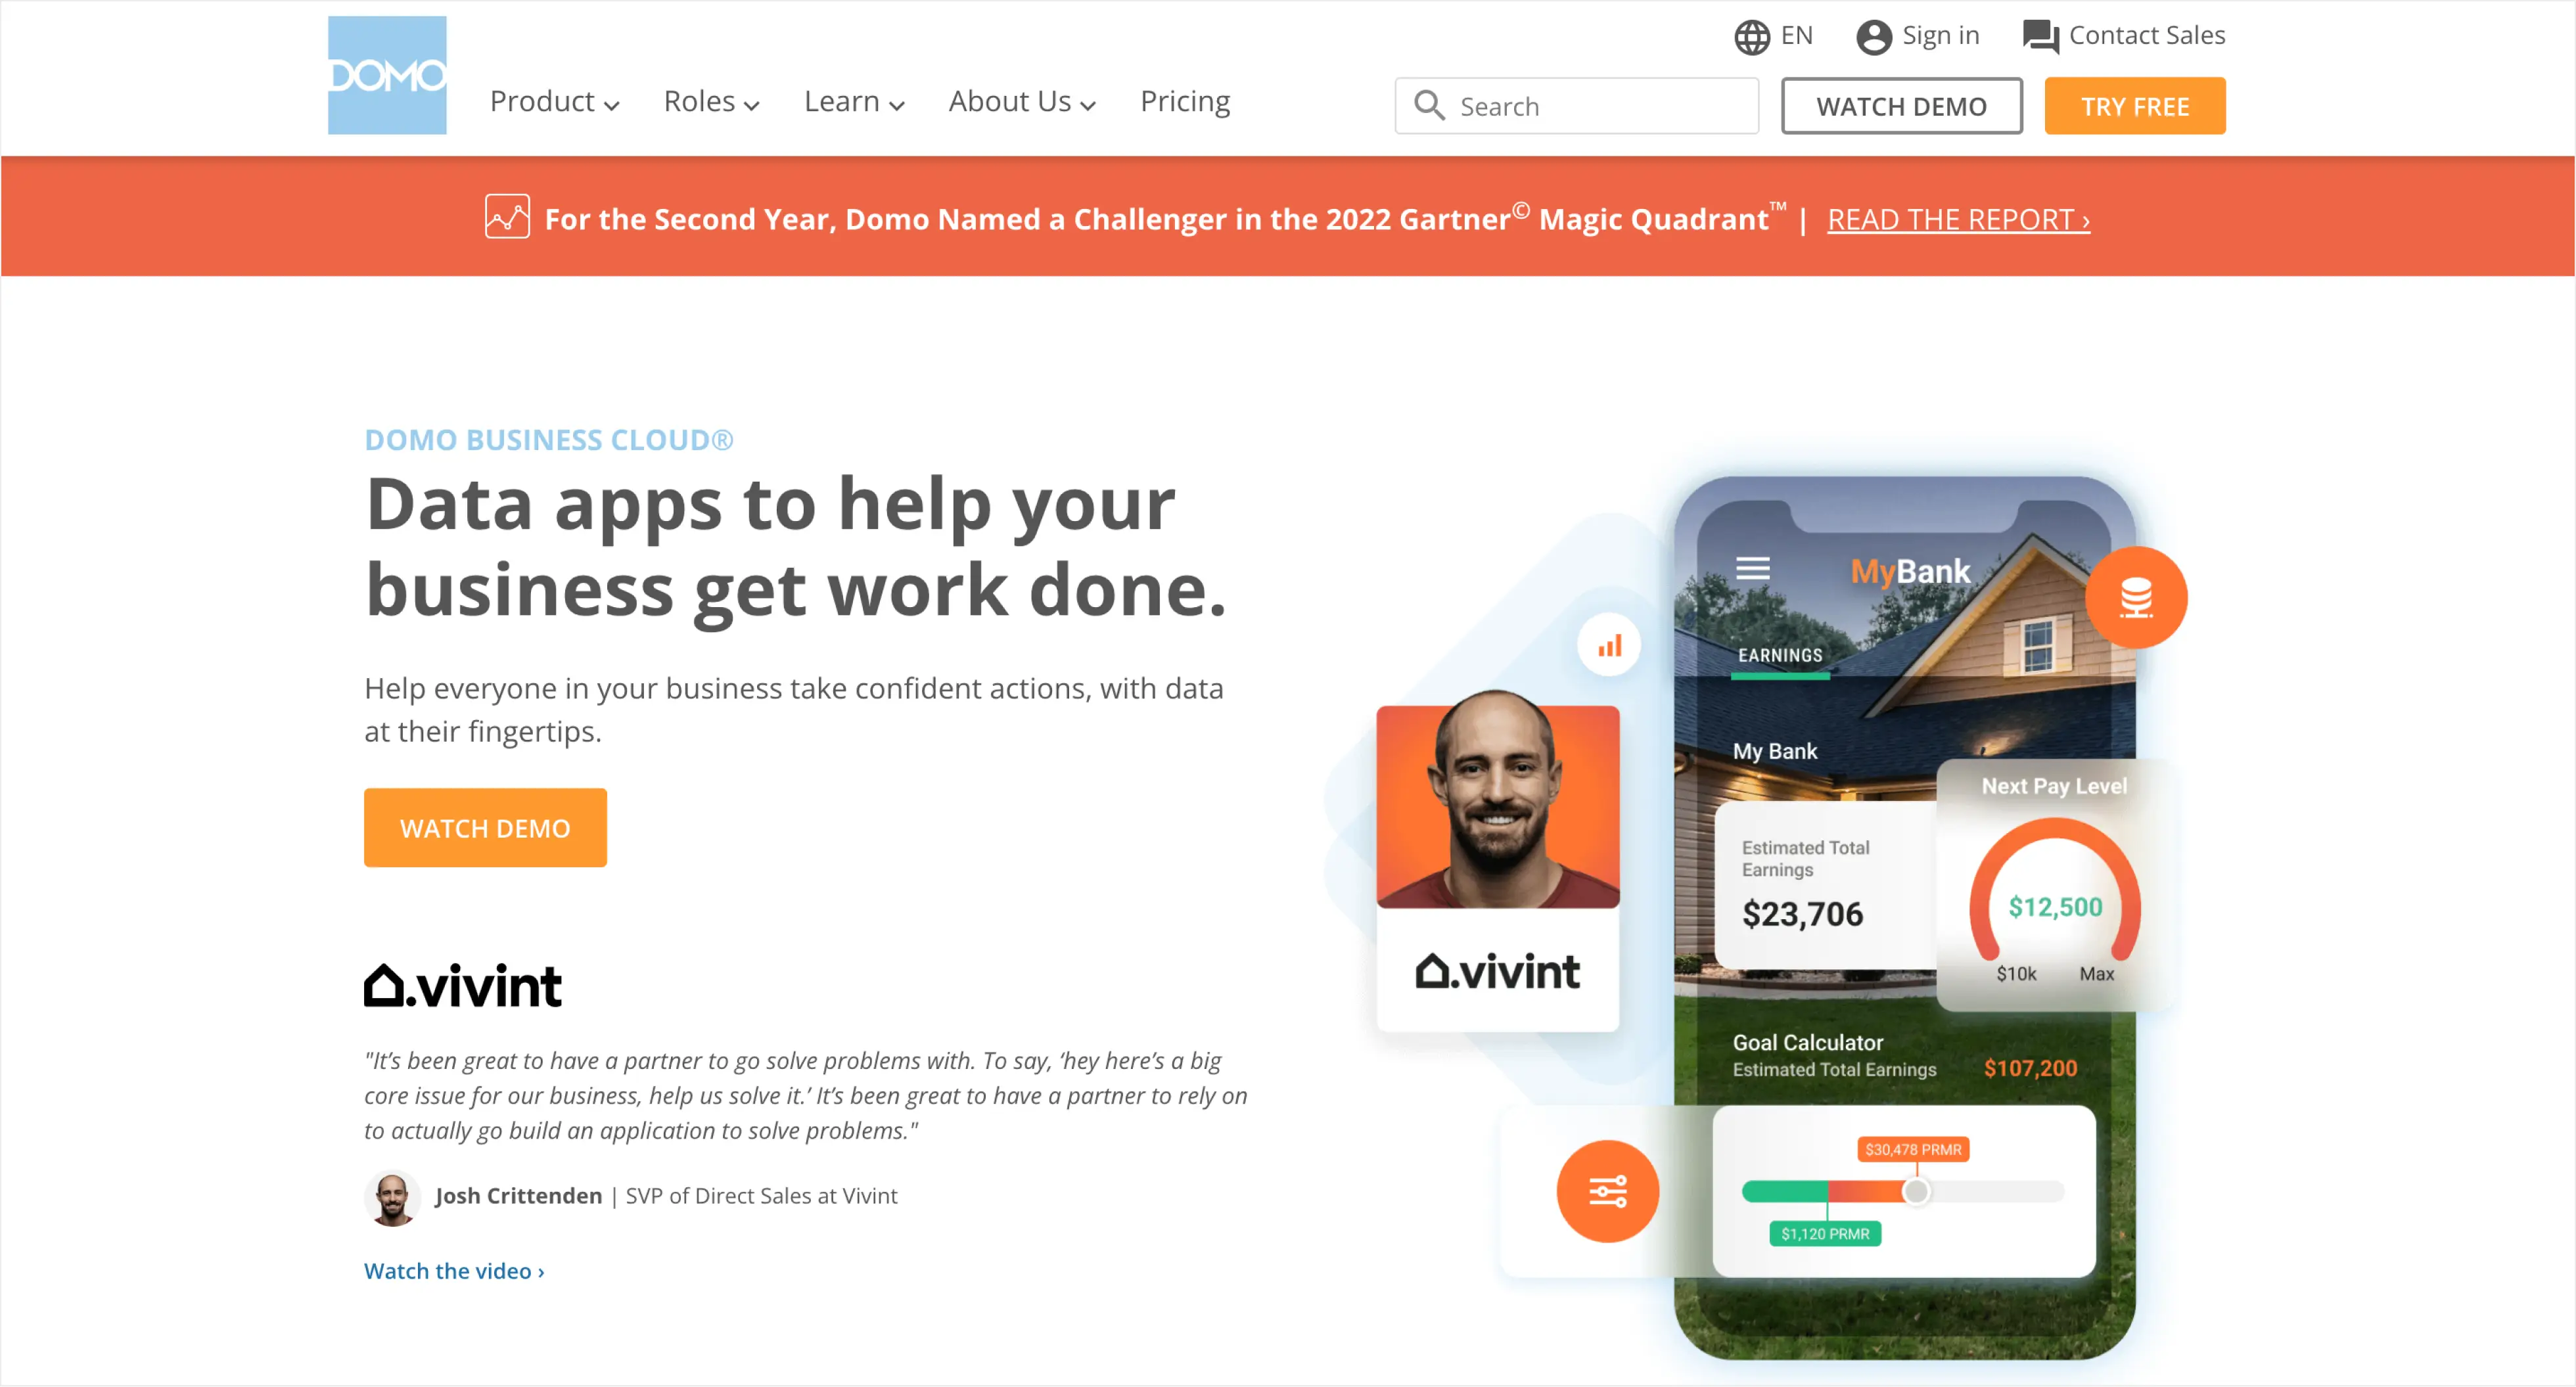
Domo is a platform for connecting and analyzing data between employees, managers, and analysts. It simplifies discussions and decision-making. It is able to connect to 450 data sources. The service is scalable according to user needs. With Domo, you can create your own dashboard and merge data from different programs, manage tasks and projects, assign performers, and exchange messages and files. Notifications, automated reports, APIs, and the Domo Apps store are also available.
Pros:
- Wide range of connectors
- No limit on data storage
- Outstanding sharing features
- Solid data visualization capabilities
Cons:
- Not intuitive user interface
- Not suitable for newcomers
- Slow processing for large datasets
- High price
12. Datorama – artificial intelligence-based analytics platform
Datorama is an artificial intelligence-based analytics platform that can be used to analyze data and build reports. It collects and aggregates data on one platform, analyzes it, builds reports, and finds insights. Other useful features include automatic goal prediction and cross-platform management, i.e. you can set up campaigns in Google, Facebook, and other tools connected to Datorama.
Pros:
- Data visualization
- Report customization
- Reporting templates
- Pivot tables
- Importing data from APIs
Cons:
- Confusing name conventions
- Frequent website crashes
- Unintuitive interface
- High price
- Issues with rigid structures
13. Whatagraph – marketing analytics dashboard solution
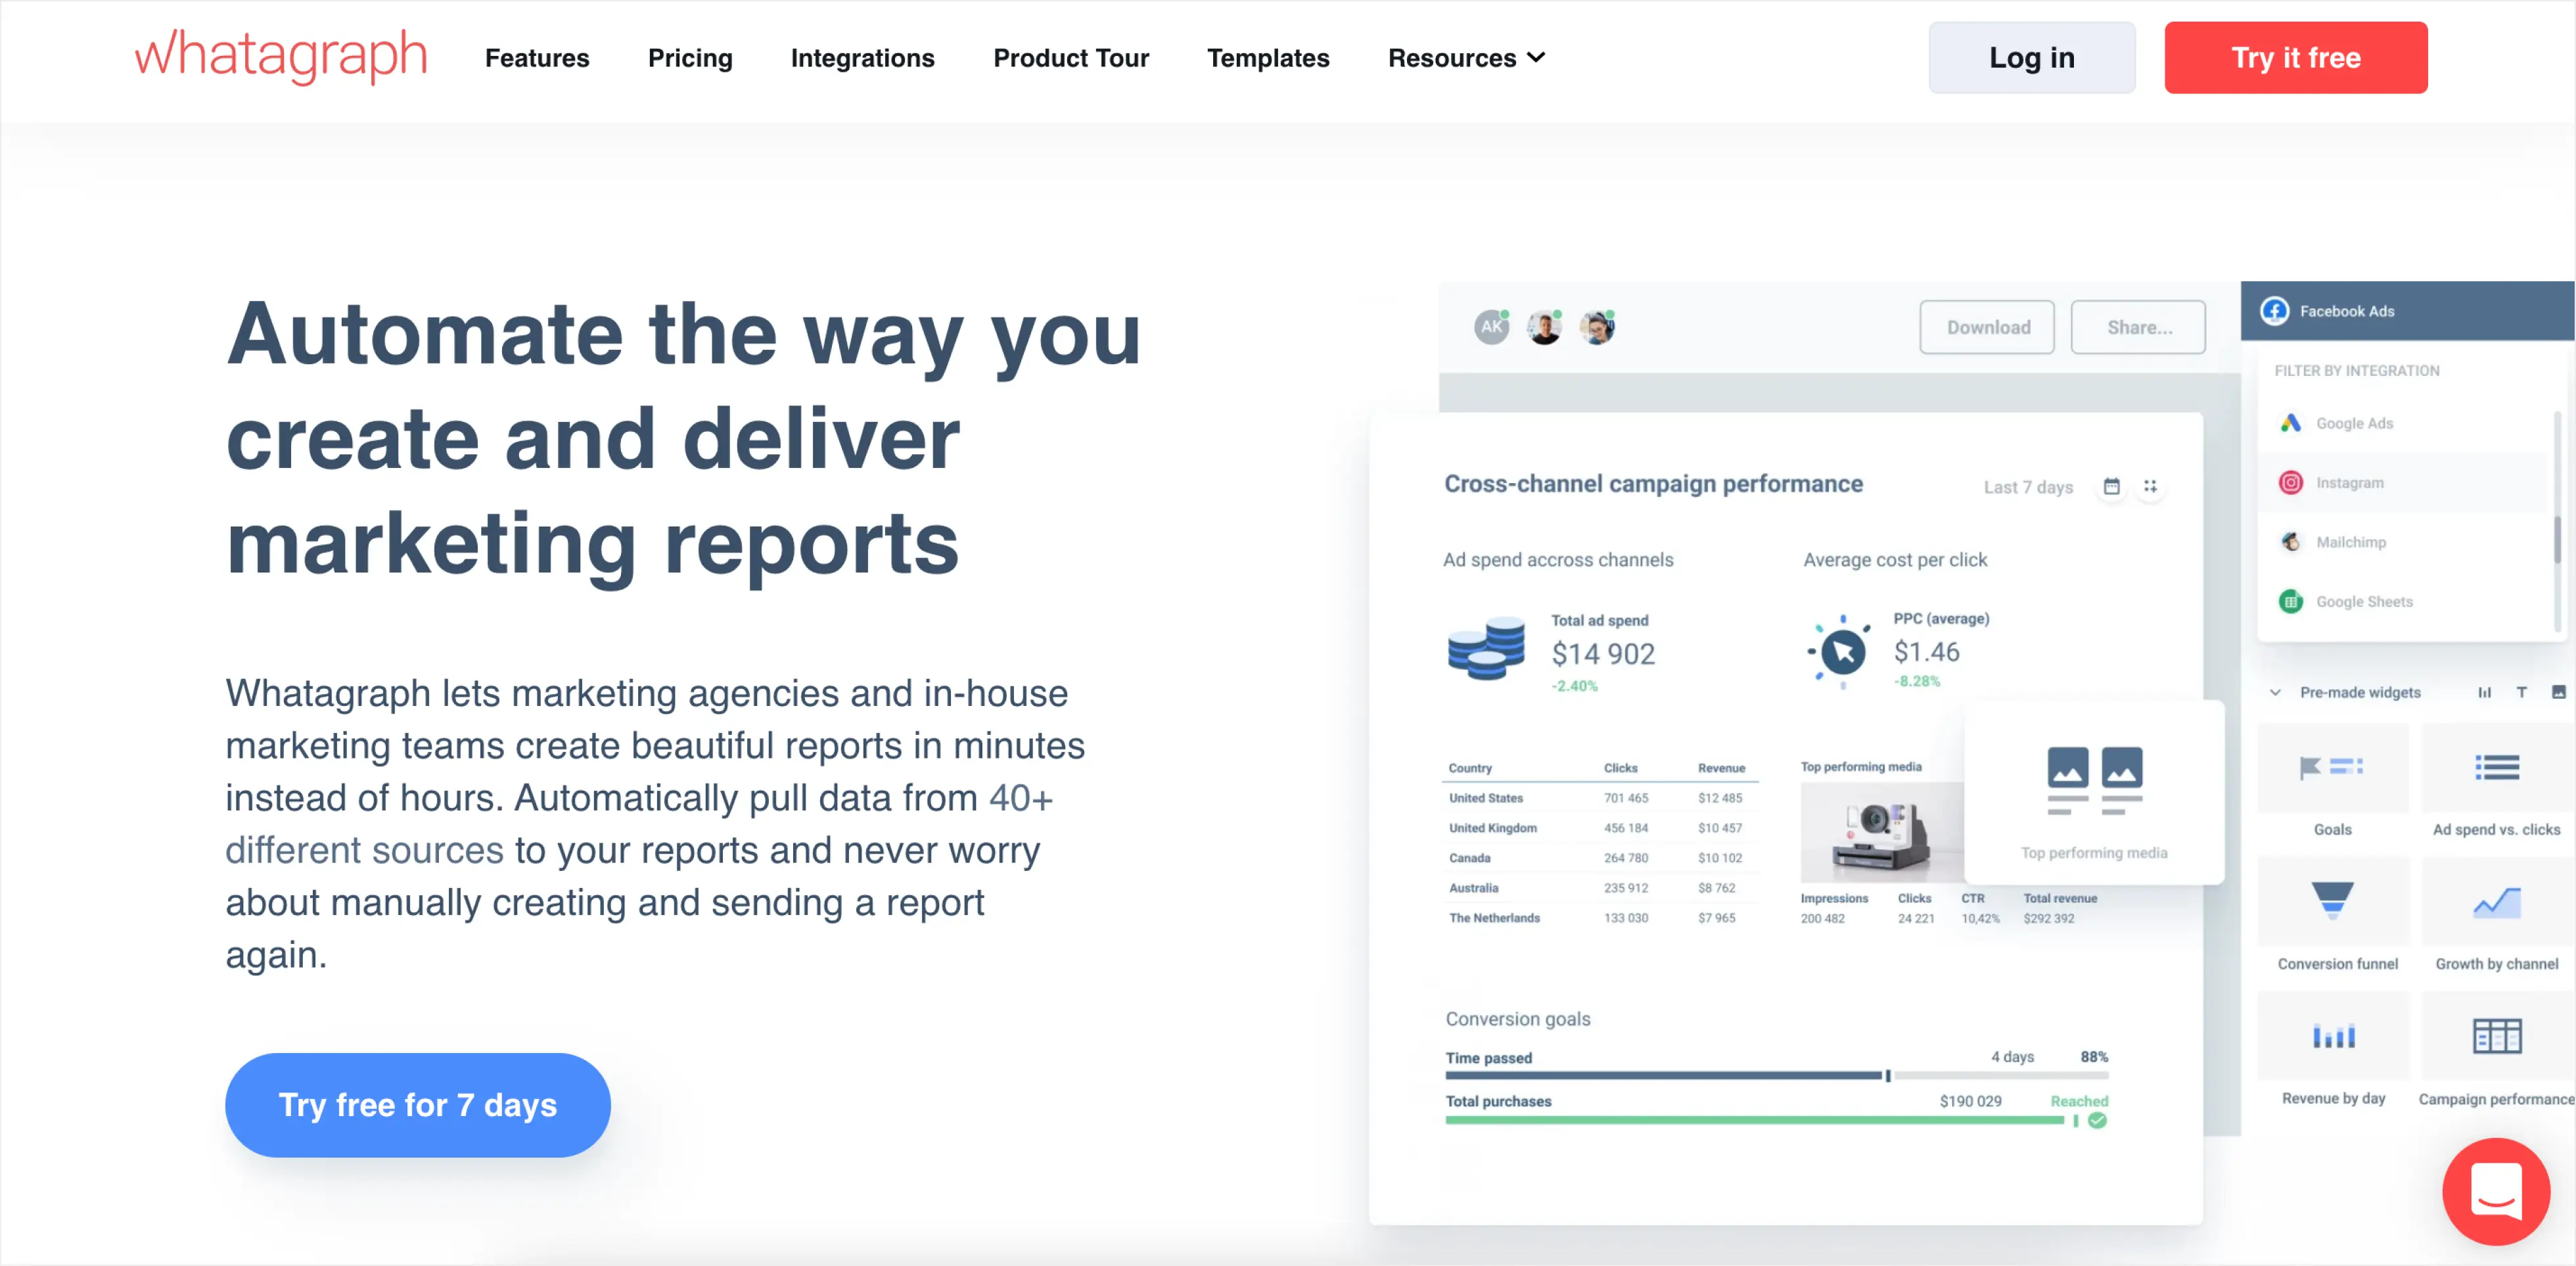
Whatagraph is a marketing analytics dashboard solution that offers analytics for social media, PPC, SEO, and email campaigns. Visual analytics is created based on various integrations — from Twitter to Google Analytics. Whatagraph can connect to over 0 different data sources. With Wathagraph’s automatic report generation, you’ll never miss a deadline, because you’ll automatically receive reports in the selected order.
Pros:
- Easy-to-navigate interface
- Reports personalization
- Custom formulas
- Custom metrics
Cons:
- Data sources can be spontaneously disconnected
- High price
- A limited number of integrations
- Slow customer support
14. Cyfe – marketing data dashboard service
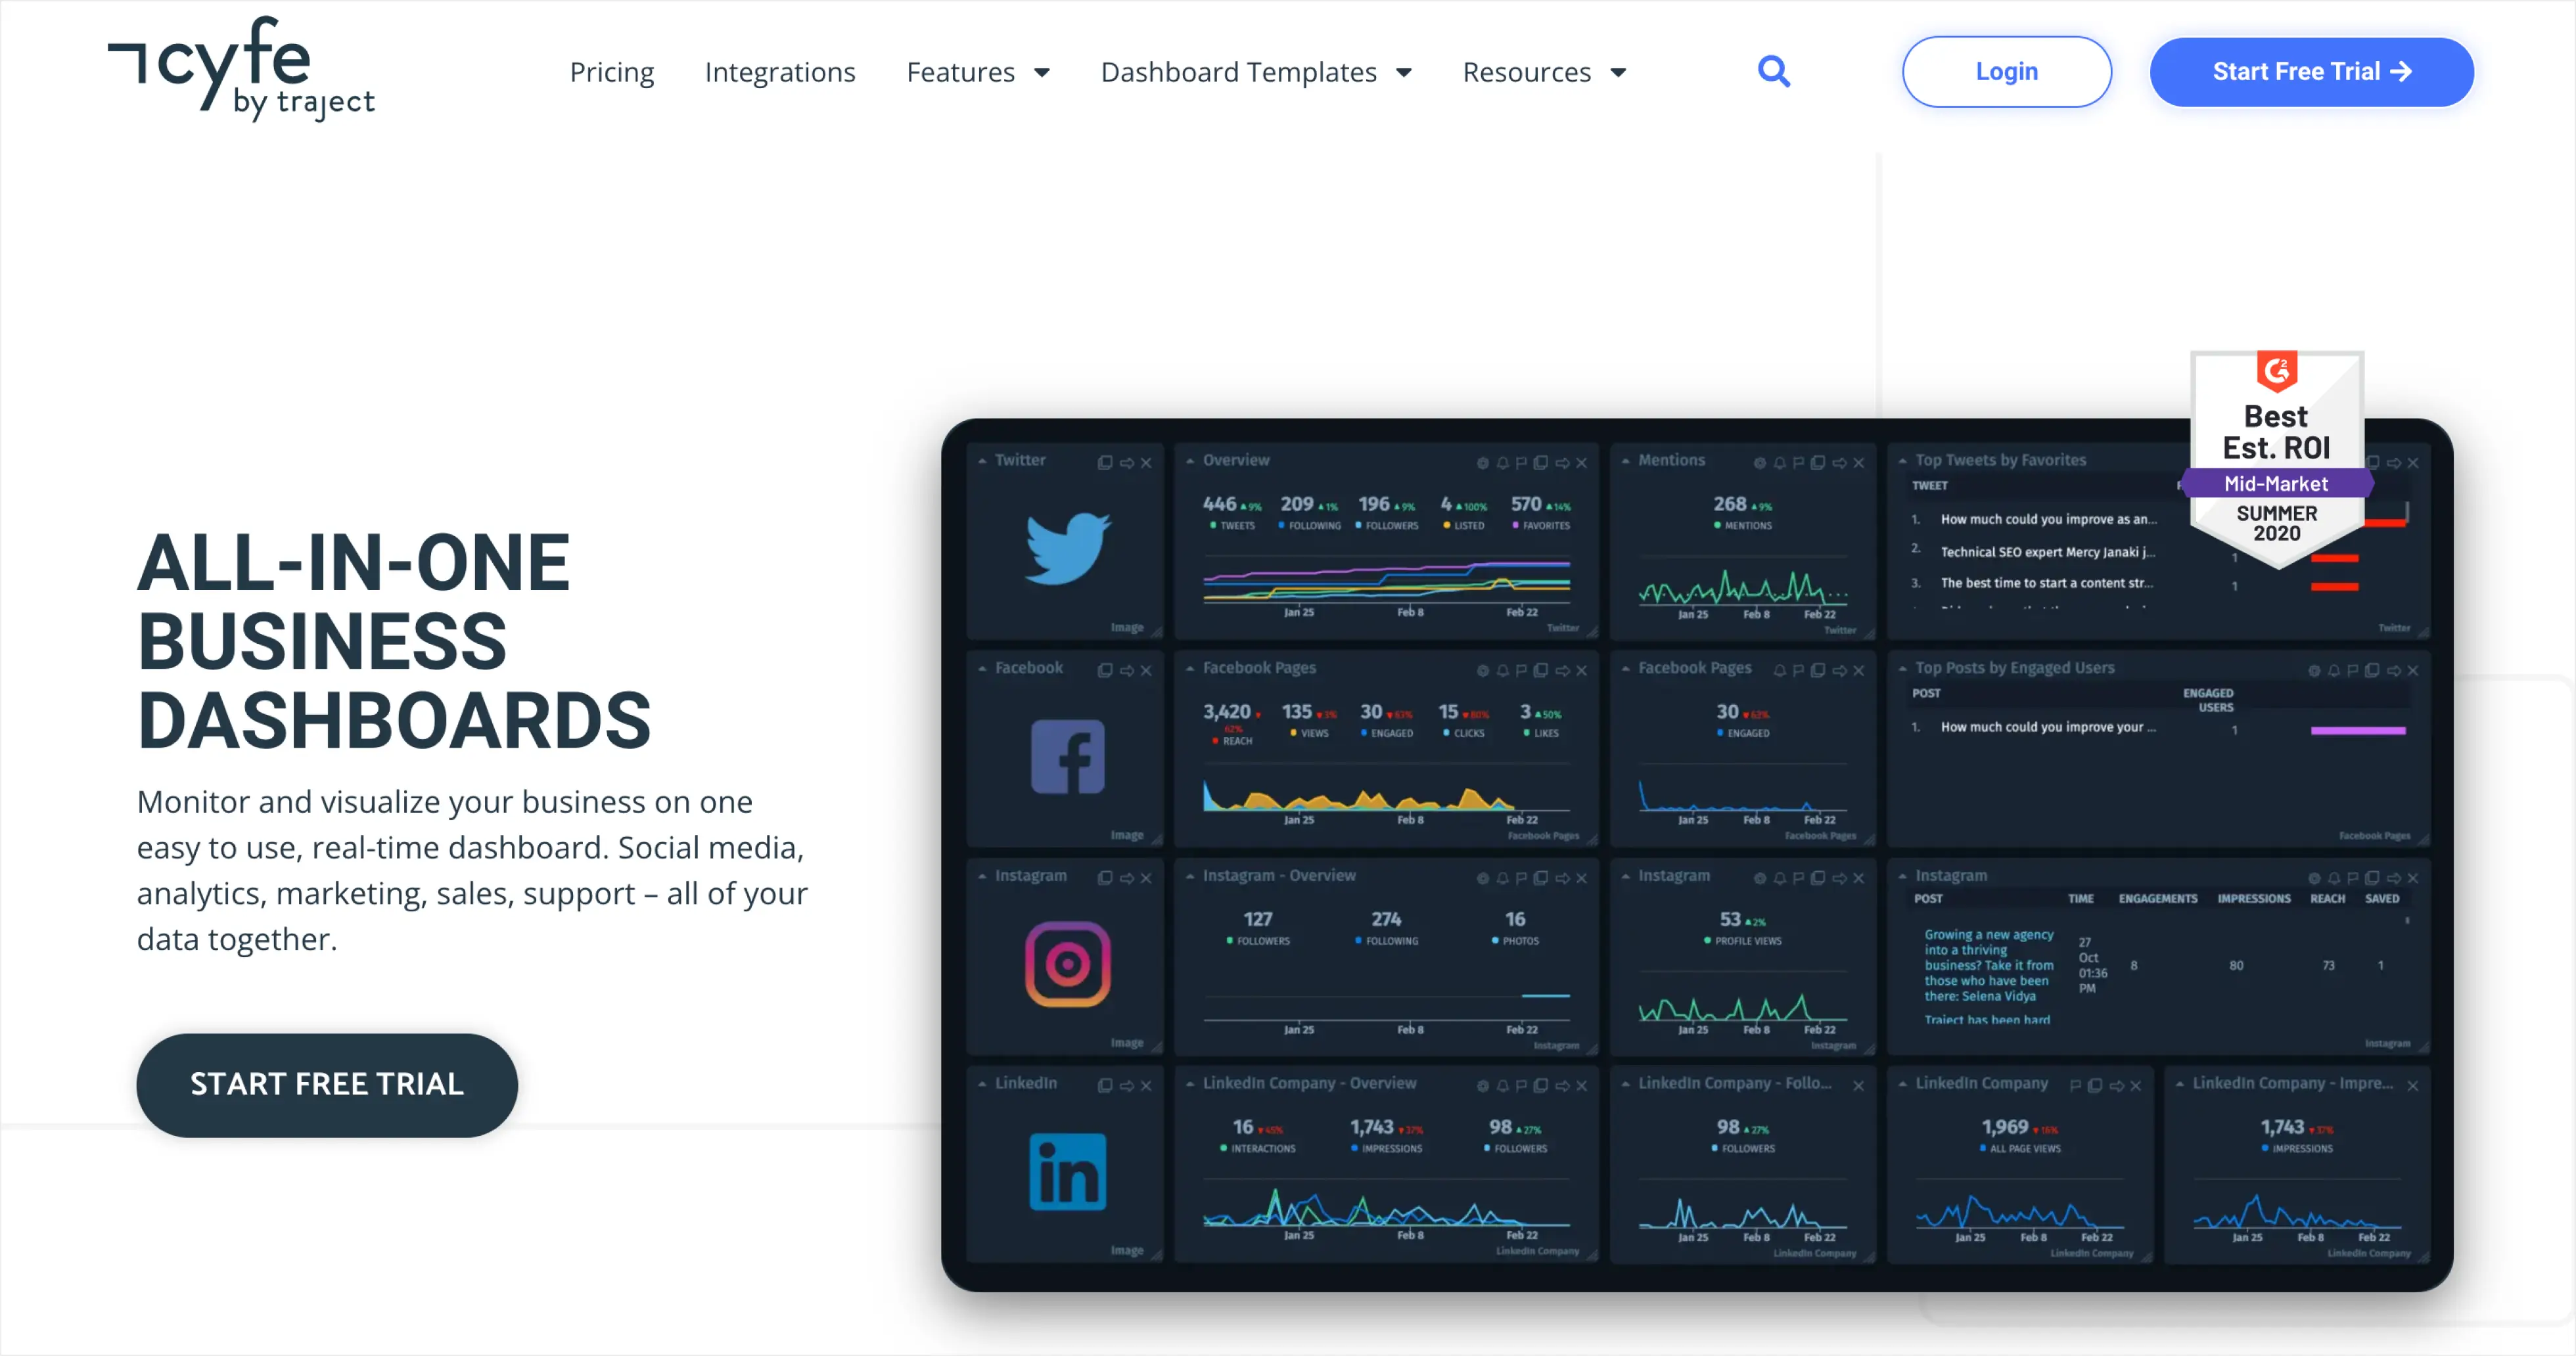
Cyfe is a marketing data dashboard service to monitors all marketing channels, including email marketing, SEO, SEM, SMM, web analytics, and more. This is the data of the Start pack community. All the data can be tracked in a single application on business dashboards. The platform offers easy and fast creation of custom dashboards by using pre-built widgets, templates, and automated reports.
Pros:
- Cost-effective
- Wide range of plugins available
- Intuitive interface
- Auto-reporting
Cons:
- No mobile app
- No qualitative metrics
- No search feature for quick access for users with multiple accounts
- Documentation is sparse
15. Tableau – marketing reporting dashboard software
Tableau is marketing reporting dashboard software that uses machine learning and artificial intelligence to collect and analyze marketing data, which can then be used to visualize results using a drag-and-drop feature. Tableau offers the ability to provide additional information security by integrating your own security protocols. As for integration with other tools, Tableau offers a list of over 60 native connectors.
Pros:
- Intuitive data representation
- Real-time reporting
- Team access
- Trend lines and heatmaps
Cons:
- High price
- Slow performance for large datasets
- Lack of customization
- Difficult to use
16. Datapine – data visualization and business intelligence in one package
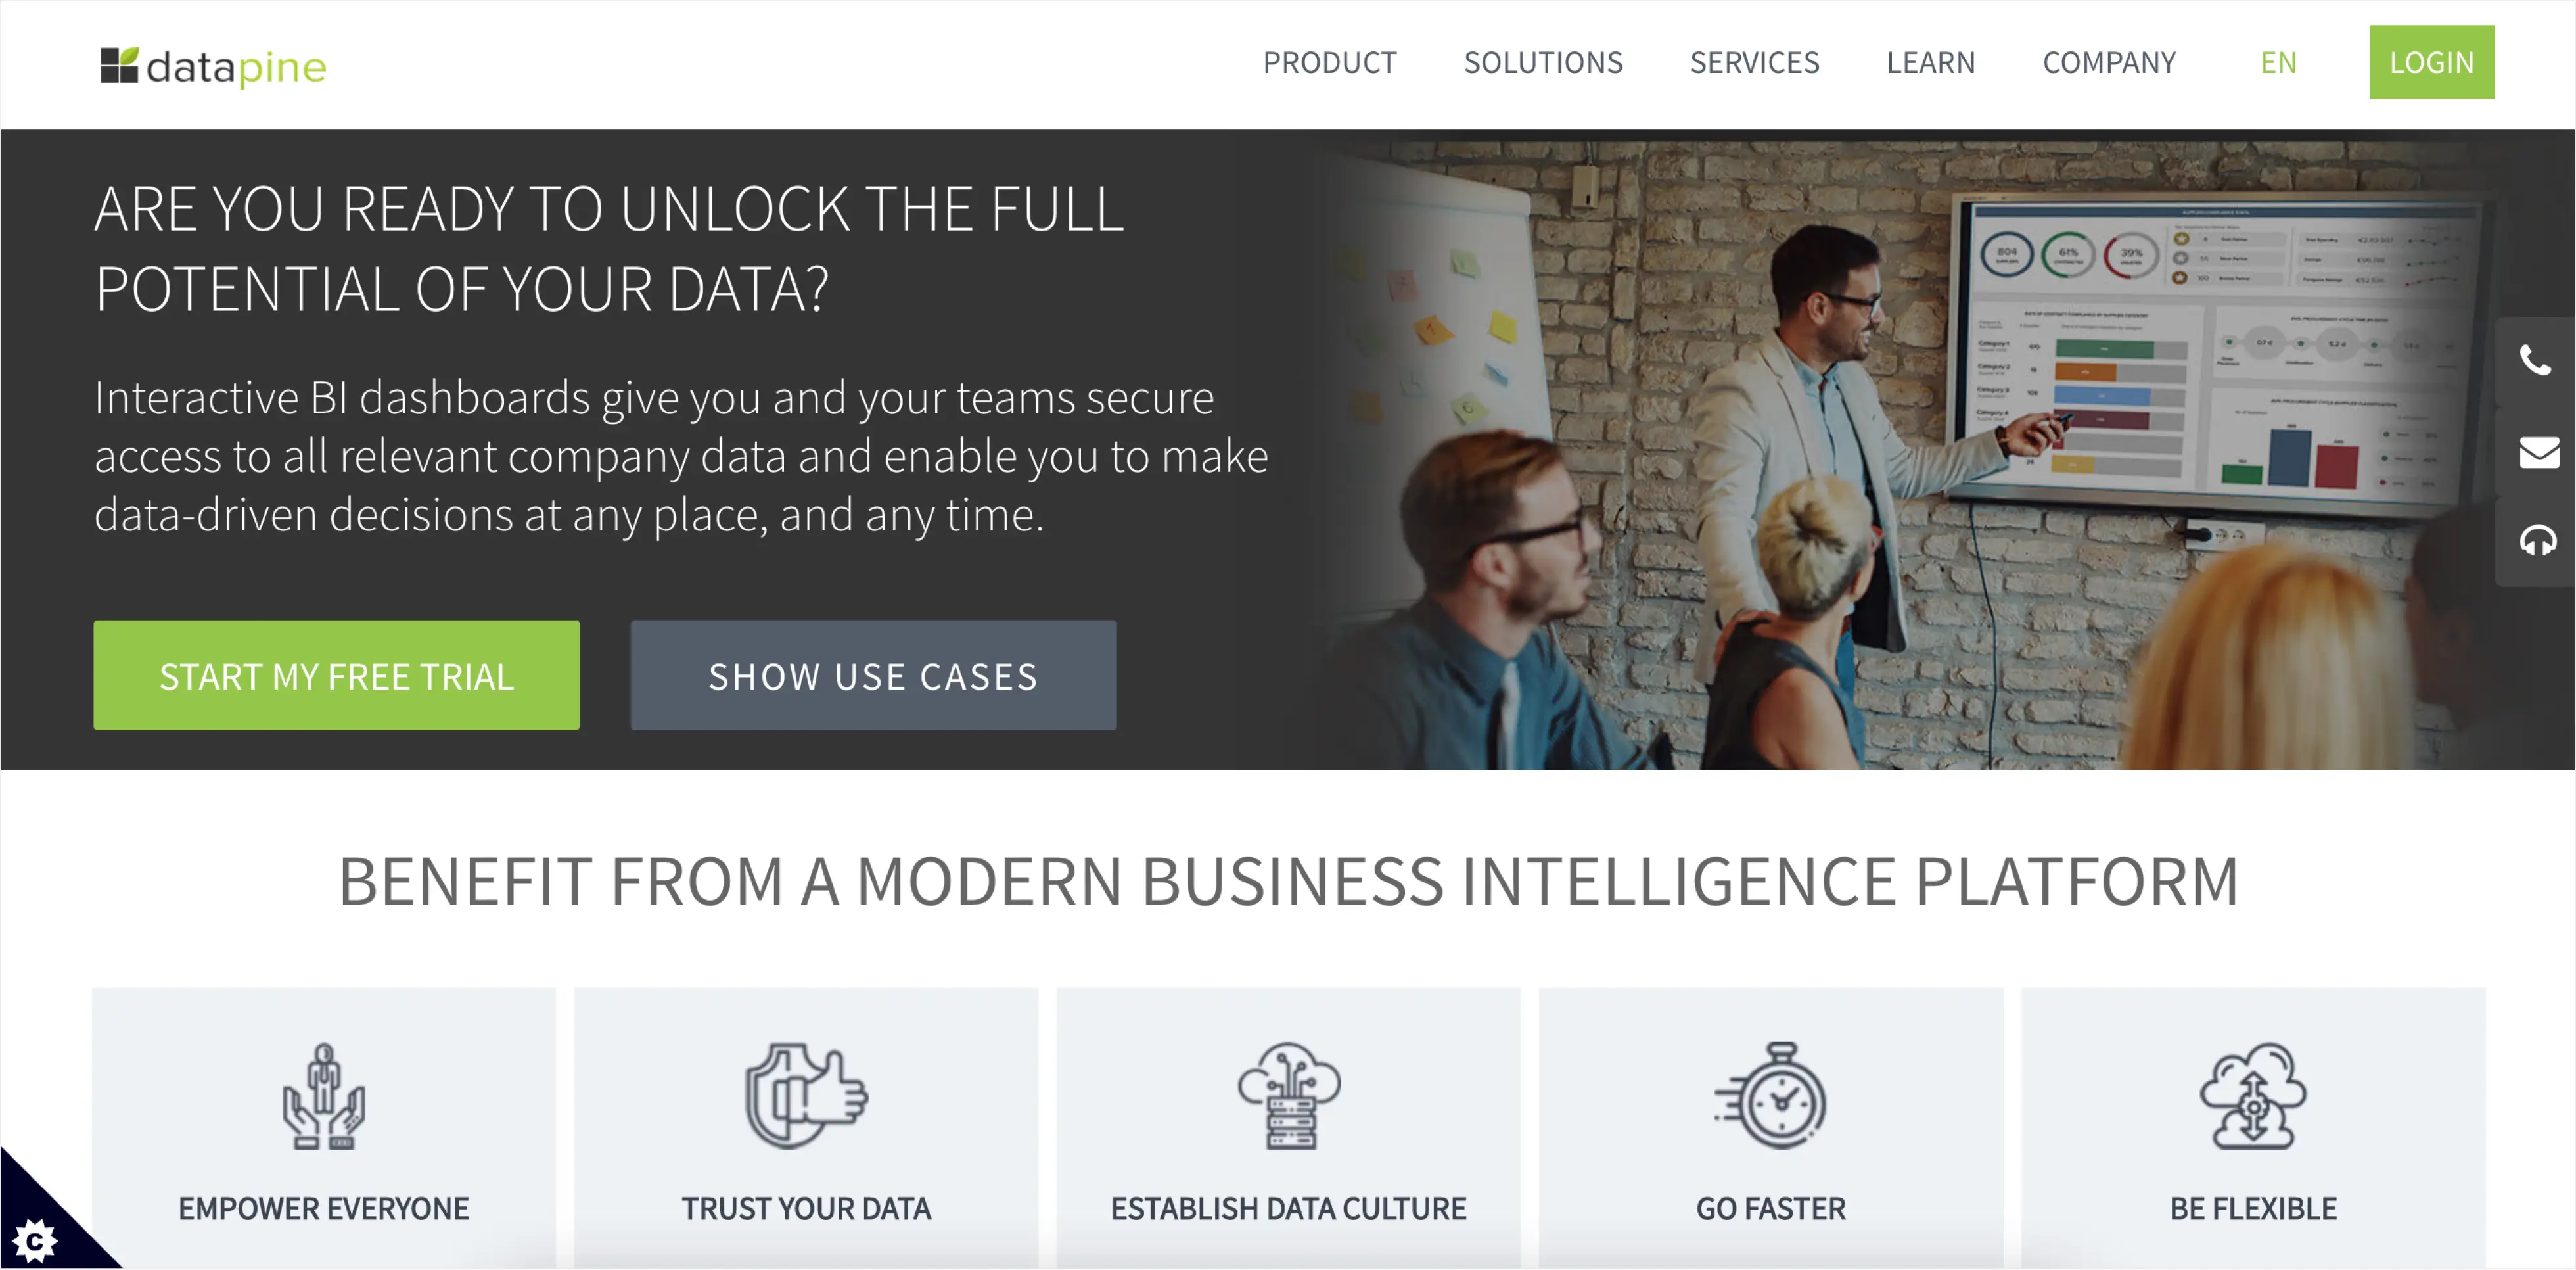
Datapine is a tool for data visualization and business intelligence in one package. The program helps companies and organizations better understand their data, which in turn allows them to make smarter business decisions, develop and implement effective strategies, and achieve goals in the fastest and most efficient ways possible. The user-friendly interface allows everyone to participate in the analytics process regardless of technical skill level. With a set of powerful features such as an intuitive interface, interactive dashboards, and customizable reports, users can interact with their data at a deeper level.
Pros:
- Intuitive interface
- Dashboard templates
- A wide range of reporting options
- Helpful customer support
Cons:
- Advanced featured can be difficult to use
- Not enough educational materials
- Lack of documentation
- The free trial period is not enough
17. Grow – service for creating reports and business intelligence dashboards
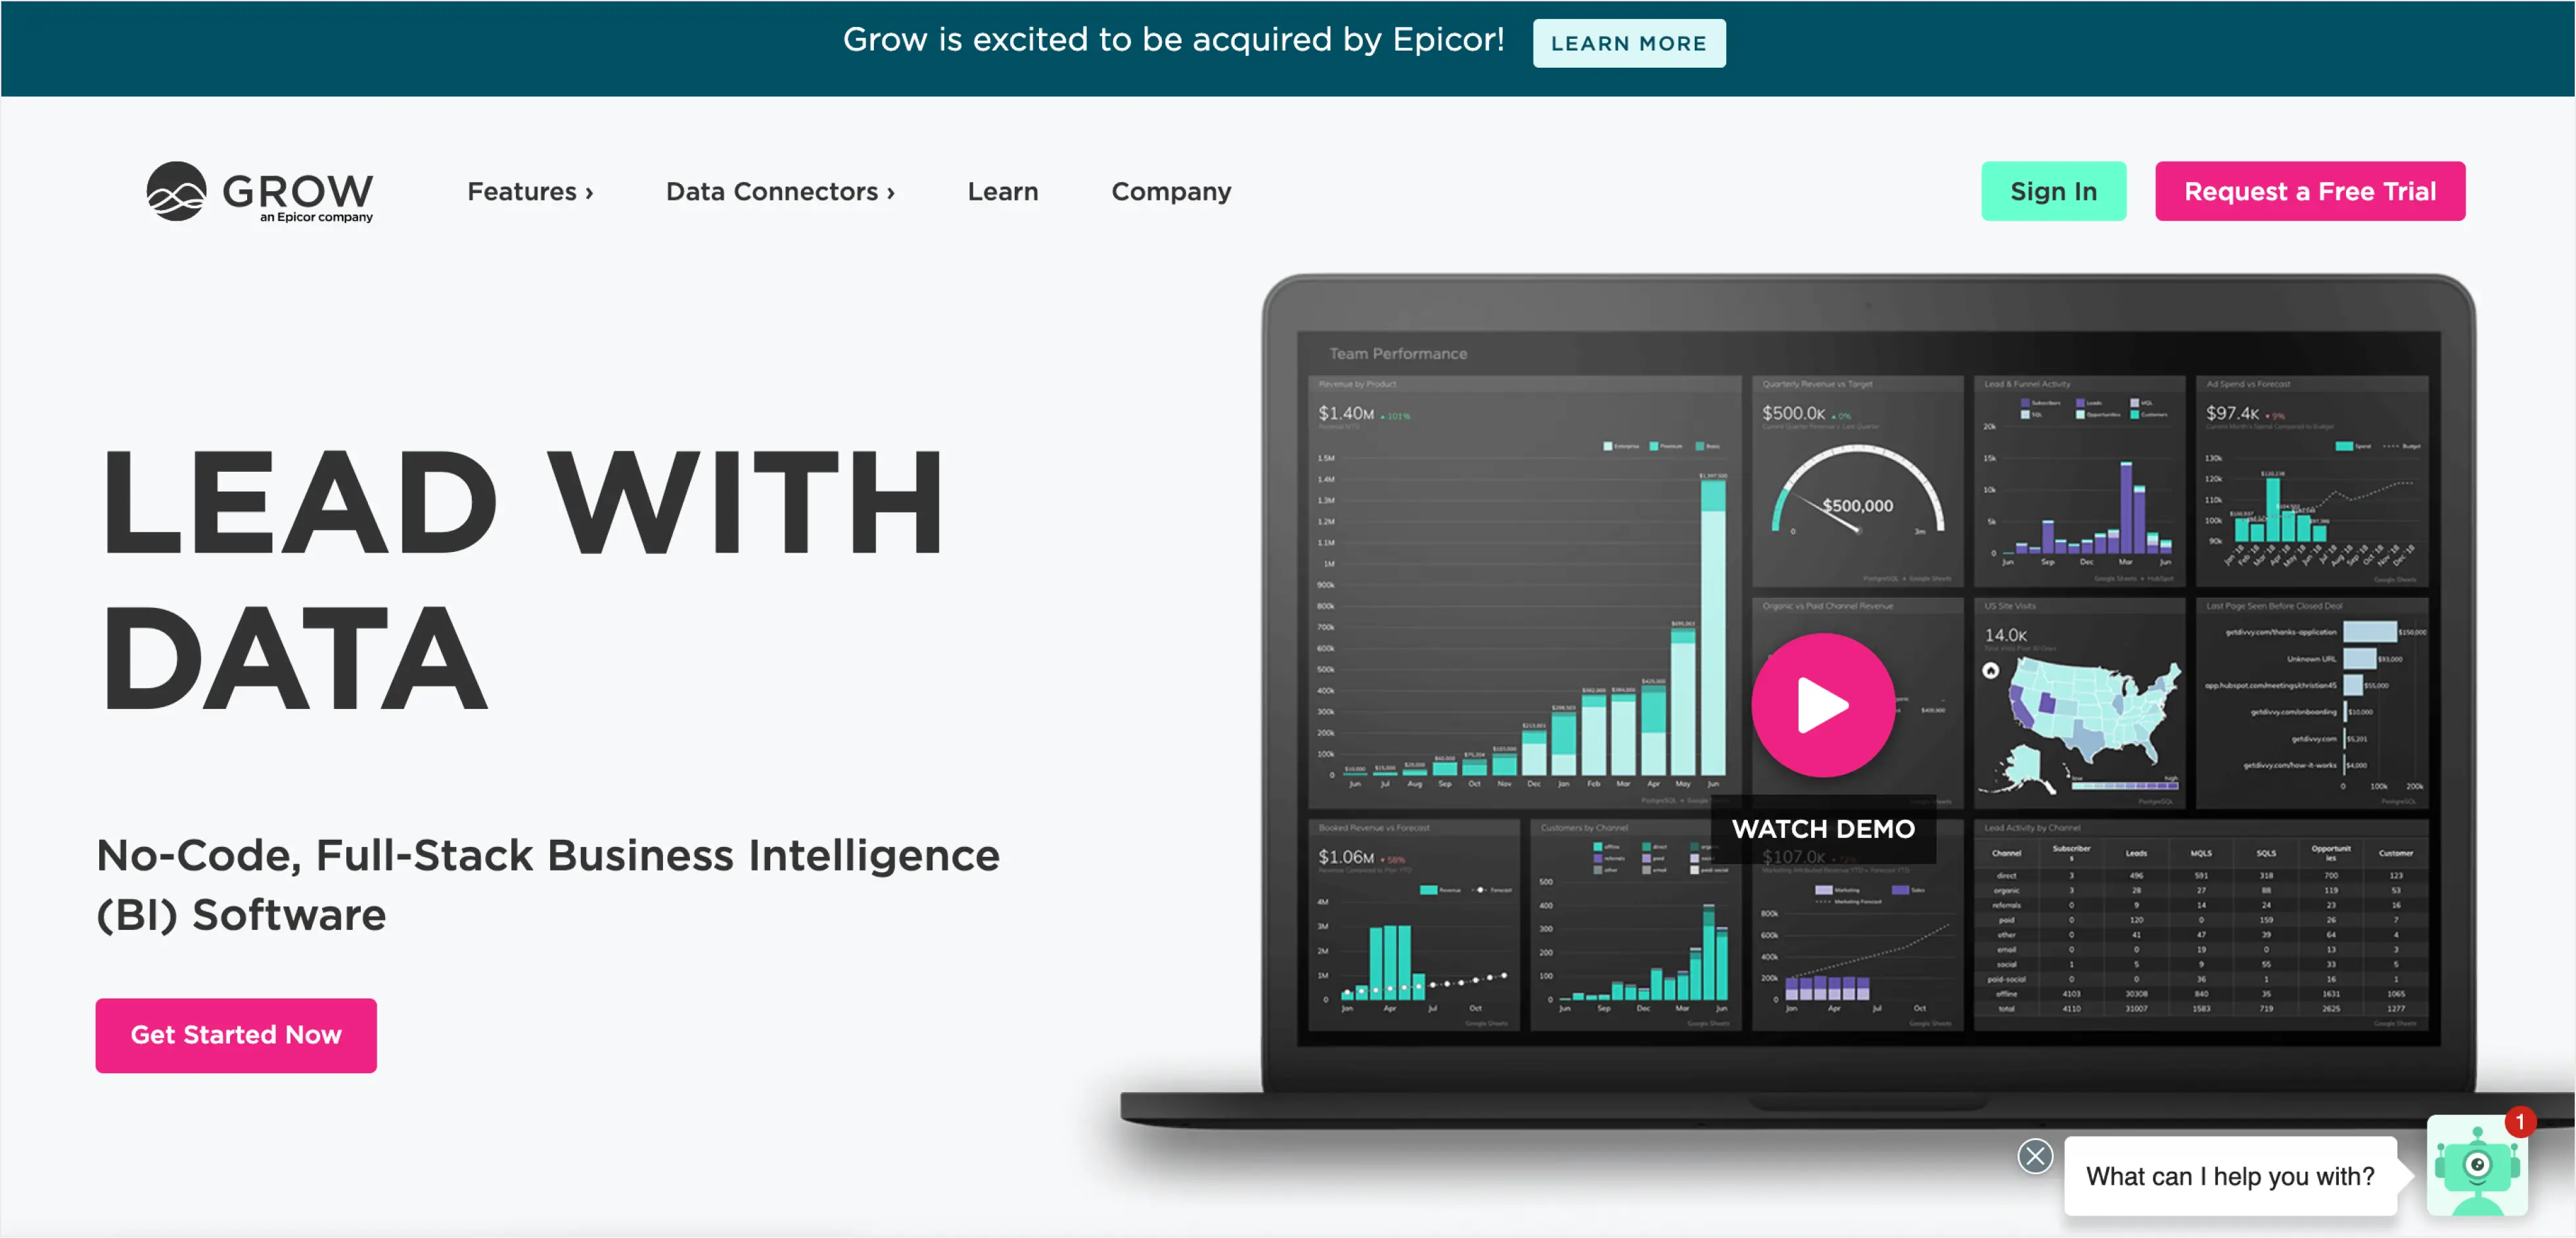
Grow is a service for creating reports and business intelligence dashboards. With Grow, users can connect to data using various integrations with applications, databases, CRM, financial reports, spreadsheets, and so on. The service helps you create dashboards of analysis for every department, team, or employee in the company so everyone can access the most important metrics. Grow helps you consolidate disparate data with customizable dashboards in real-time.
Pros:
- Scalability
- Easy to use
- Helpful support team
- Easy to customize
Cons:
- High price
- No clean navigation between different dashboards
- No preview option
- Troubles joining multiple reports together
- Long loading time
18. AgencyAnalytics – performance marketing dashboard tool
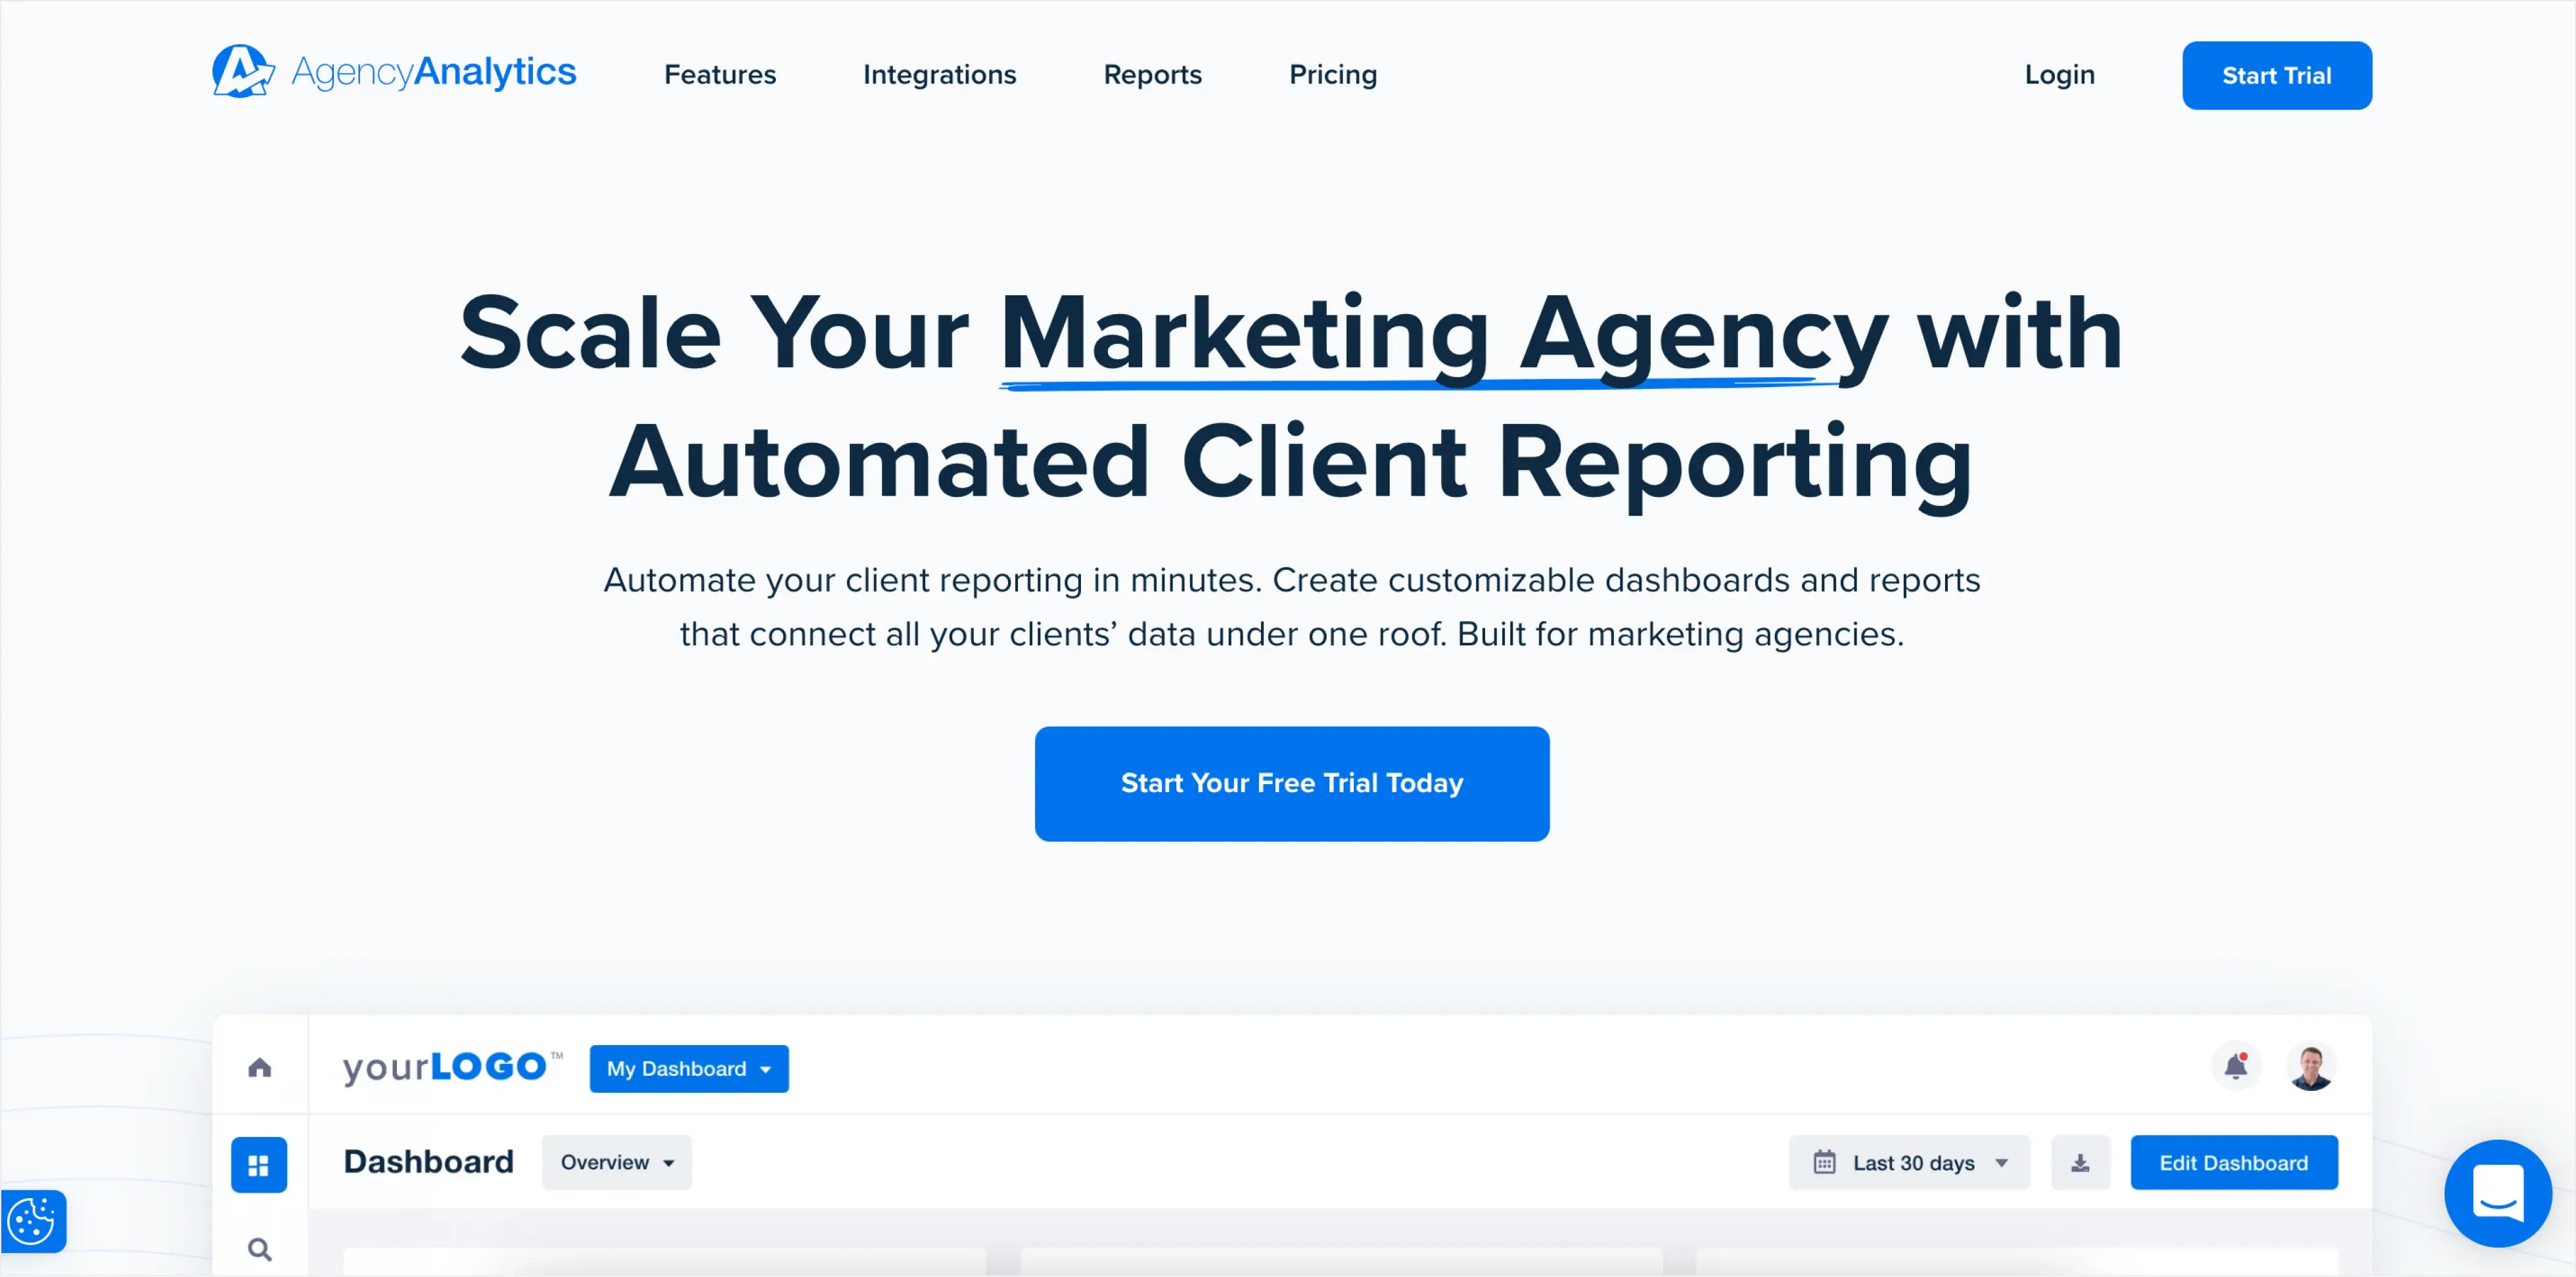
AgencyAnalytics is a performance marketing dashboard tool that allows you to create reports and personalized dashboards, conduct SEO audits, track keywords, etc. Keyword tracking, SEO auditing, backlink monitoring, social analytics, reporting — all that can be done with multiple integrations and personalized dashboards.
Pros:
- Data visualization
- Customer support
- Easy to use
- Unlimited user and client logins
Cons:
- Slow report generation
- Limited customization of imported data
- Limited integrations
19. GoodData – tool-rich marketing reporting dashboard solution
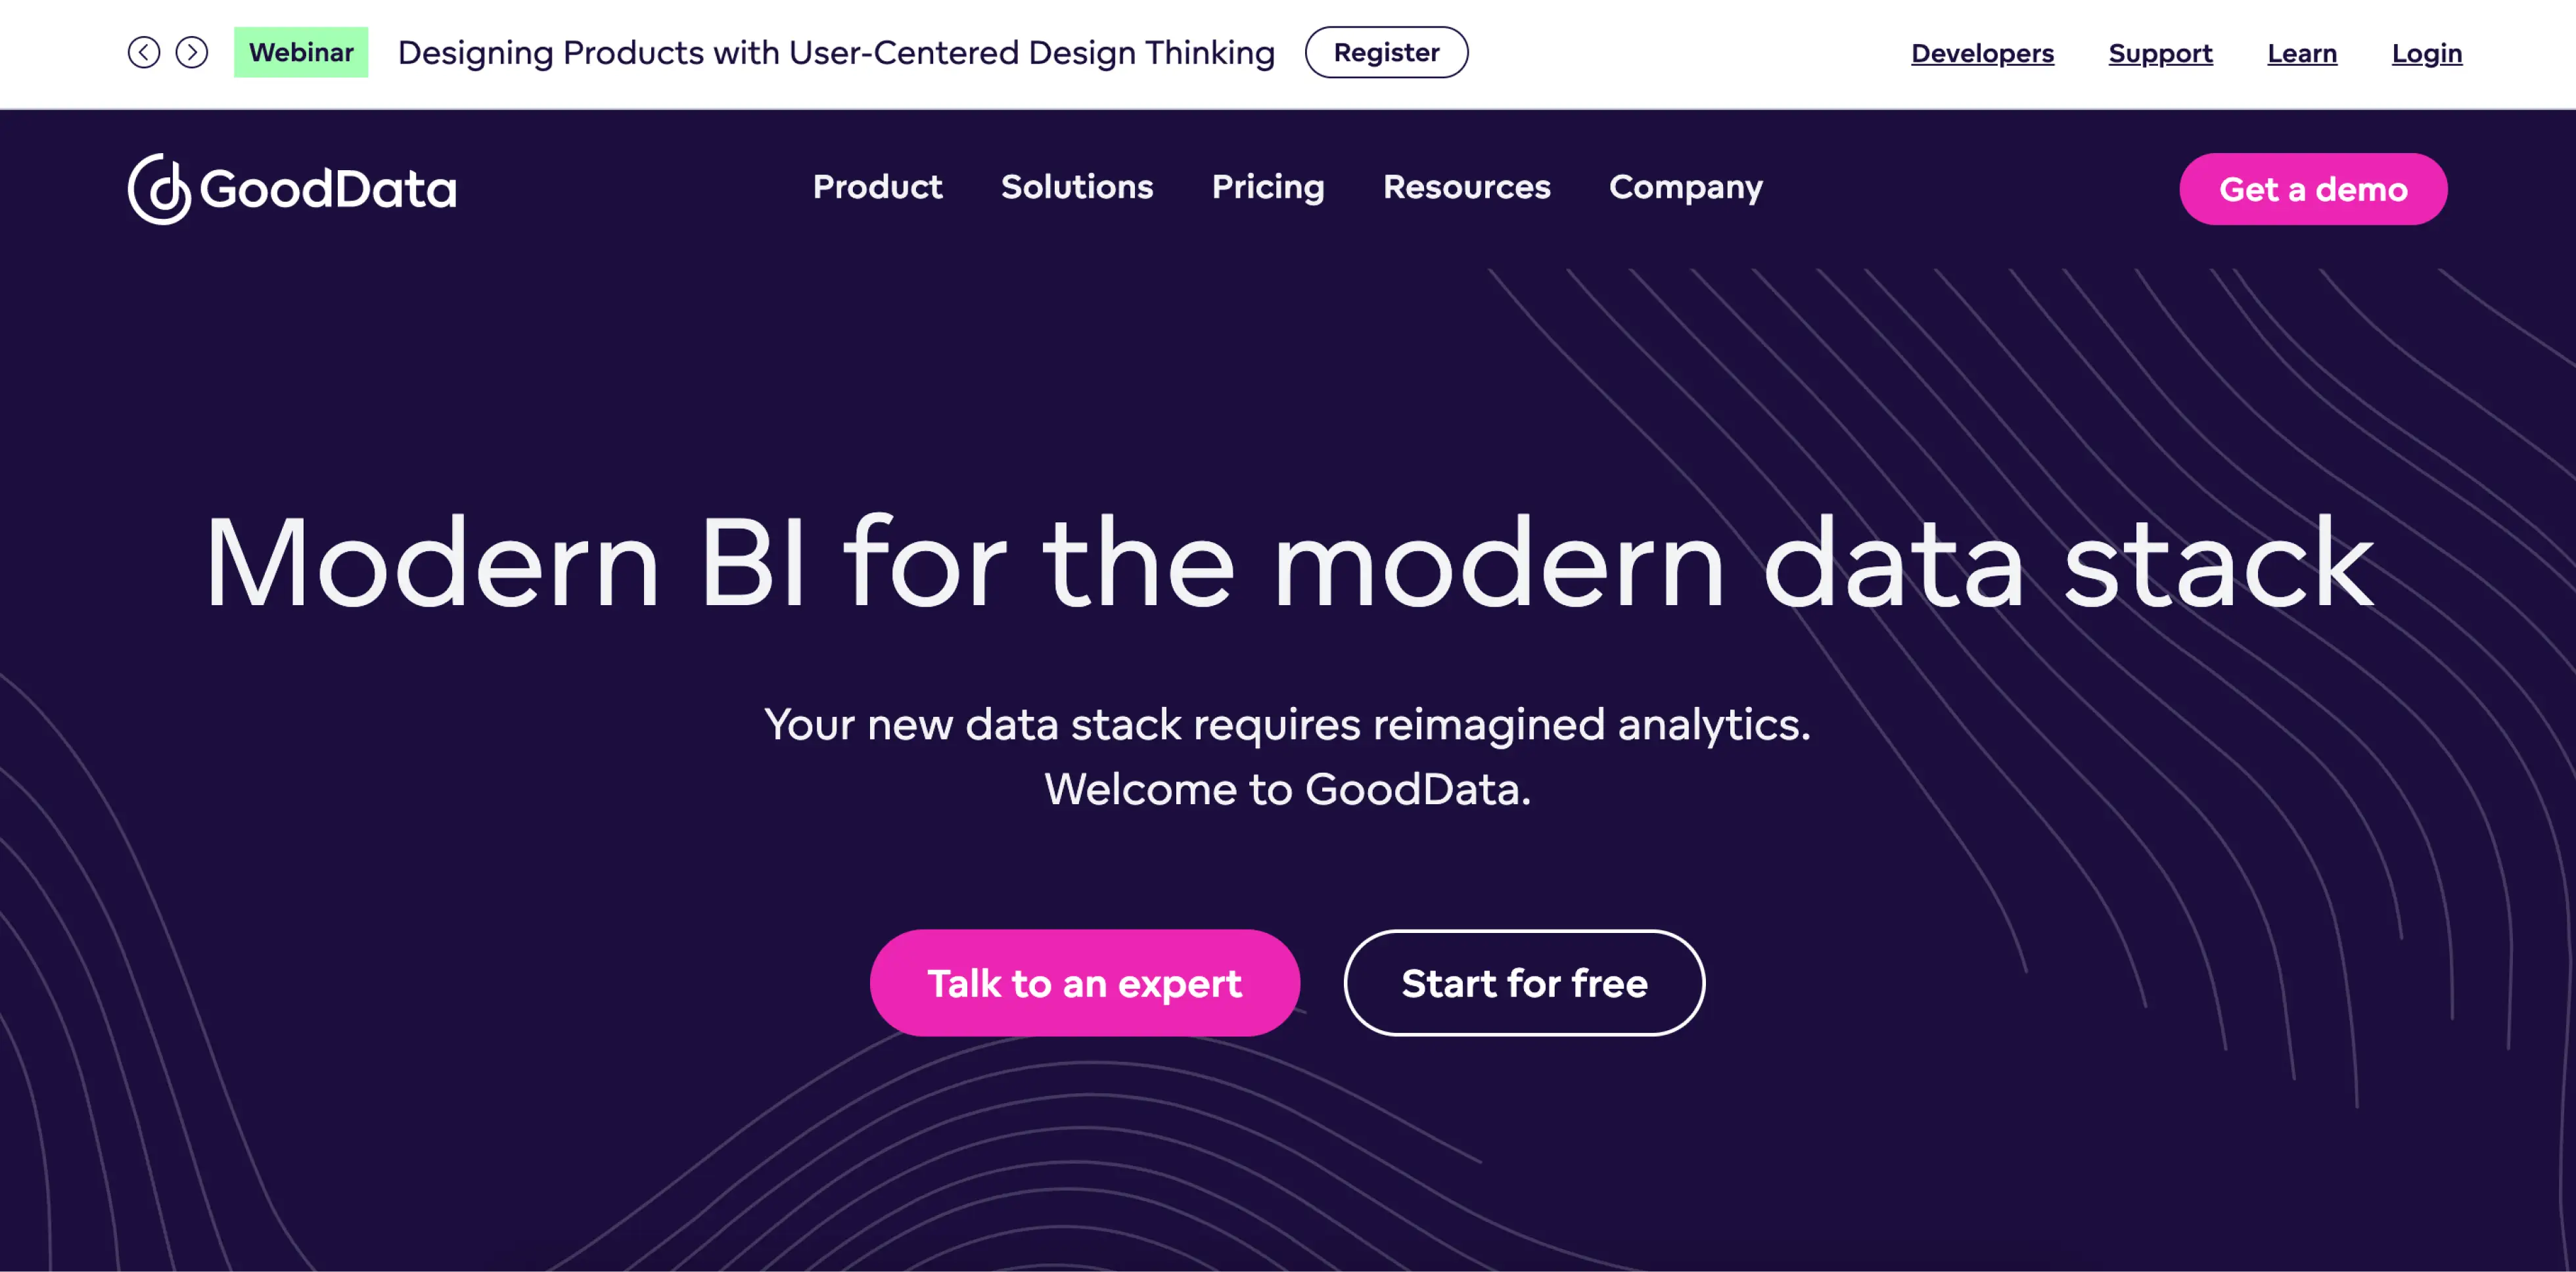
GoodData is a tool-rich marketing reporting dashboard solution built for integrated data analysis and storage. It is fully customizable and can easily be adapted to a company’s business flow. Users do not need advanced technical knowledge to leverage GoodData to retrieve the necessary insights, discover trends, and uncover new business opportunities. The software pulls data from various data sources and provides instant access to ad hoc reporting.
Pros:
- Easy linking of disparate data sources
- Fast implementation
- Easy to integrate into custom applications
- Manual and automatic data loading
Cons:
- High price
- No on-premise option
- Difficult to use
- Limited customization options
20. Zoho Analytics – self-service BI and data analysis software
Zoho Analytics is self-service BI and data analysis software that allows you to create visually appealing data visualizations and useful dashboards in minutes. With Zoho Analytics, you can transform vast amounts of raw data into actionable reports and dashboards, track your key business metrics, see long-term trends, identify outliers, and uncover hidden insights. You can also mix data from multiple sources together to create cross-functional reports and dashboards to see the state of your business across departments.
Pros:
- Various data visualization types
- Easily shared and accessible reports and dashboards
- Delivering scheduled reports
- Simple widget creation
Cons:
- Challenges in merging large datasets
- Syncing issues with external sources
- Some settings are cumbersome
The Bottom Line
Your business gets customers from different sources — contextual advertising, social networks, cold sales, offline outlets, etc. As a result, there is a huge amount of data that needs to be processed. Doing that manually will eat lots of your time. With the help of digital marketing dashboards, you’ll be able to process “raw” data and translate it into a convenient and comprehensive form.
Digital marketing reporting dashboards enable analysts to:
- have a better decision-making process by tracking data quickly and thoroughly;
- gain a competitive edge by aligning marketing activities with the obtained insights;
- increase efficiency by having faster access to critical business data.
To improve the quality of business decisions, you need to get simple, structured, and clear answers to your questions as quickly as possible. Digital marketing reporting dashboards can be very useful, but they vary greatly in function and price. It’s worth making sure that the tool you choose can meet your business needs and serve as a solid basis for your decision-making. Rely on our list and make your choice.


local marketing tips monthly
Enjoying this article?
You’ve successfully subscribed.
You’ll now receive curated insights, trends, and stories from franchise and multi-location brands directly to your inbox.

Enterprise: for multi-location and direct selling brands. Manage thousands of social media pages of your local distributors, partners, or franchisees.
Agency: for marketing agencies. Manage all your clients’ social media pages on one platform.
